
Article share: On the benefits of sidewalk networks
Here is another quick share of an article by Todd Litman on Planetizen. The article contains a lot of information or data about why we should be investing in sidewalks or pedestrian facilities (i.e., for walking).
Litman, T. (August 6, 2023) “Completing Sidewalk Networks: Benefits and Costs,” Planetizen, https://www.planetizen.com/blogs/124999-completing-sidewalk-networks-benefits-and-costs?utm_source=newswire&utm_medium=email&utm_campaign=news-08142023&mc_cid=cd3b2e2ba5&mc_eid=9ccfe464b1 [Last accessed: 9/23/2023]
To quote from the article:
“Walking is the most basic and universal travel mode, and sidewalks are the most basic walking infrastructure, but they are often overlooked and undervalued in transportation planning. Completing and improving sidewalk networks can help achieve many economic, social and environmental goals.
Recent case studies indicate that typical North American communities spend $30 to $60 annually per capita on sidewalks, and would need to double or triple these spending levels to complete their networks. This is a large increase compared with current pedestrian spending but small compared with what governments and businesses spend on roads and parking facilities, and what motorists spend on their vehicles. Sidewalk funding increases are justified to satisfy ethical and legal requirements, and to achieve various economic, social and environmental goals. There are several possible ways to finance sidewalk improvements. These usually repay their costs thorough savings and benefits.”
–
A zipper lane along Katipunan?
Yesterday, the Metro Manila Development Authority (MMDA) started another experiment along Katipunan Avenue in Quezon City. They introduced a zipper lane along the stretch fronting Ateneo’s Gate 2 and Miriam College’s main gate (about 740m – less than a kilometer). This single lane was supposed to ease traffic congestion along the northbound direction of Katipunan (aka Circumferential Road 5 or C5 or Pres. C.P. Garcia Avenue), which is saturated with vehicles especially during the morning peak.
While we wait for the official pronouncements regarding this experiment, the impacts are likely to be marginal as the original northbound lanes are jammed with vehicles. Thus, there is a tendency for the entry to the zipper lane to be blocked. MMDA staff will also have to stop vehicles at the exit if they will allow the movement of left-turning and U-turning vehicles at the junction with B. Gonzales and Miriam’s main gate. While it may seem an exercise in futility, we have to appreciate the continuing effort of MMDA for such schemes. The bottomline though is the MMDA has limited options to address the hellish traffic along Katipunan. The schools and other establishments would need to put their heads together to formulate a more sustainable solution for this corridor.

Traffic and the changing Katipunan cityscape
The traffic situation along Katipunan Avenue has worsened over the years. While there was some respite from the usual congestion experienced along the stretch of interest that has 3 major schools and a mall during the pandemic, ‘traffic’ is back with a vengeance and the new normal seems worse than the old. That Katipunan has changed a lot over the decades is an understatement. The photo below shows high rise buildings completed and under construction. All of these are residential condominiums along Katipunan and Xavierville. Many students now reside there and walk, cycle or take public transport to school. Enrollment though at Ateneo, Miriam and UP has also increased over the years. That means more trips generated by the schools. And with many still dependent on cars for their commutes, it is no wonder that the traffic situation is usually hellish especially during the peak hours.
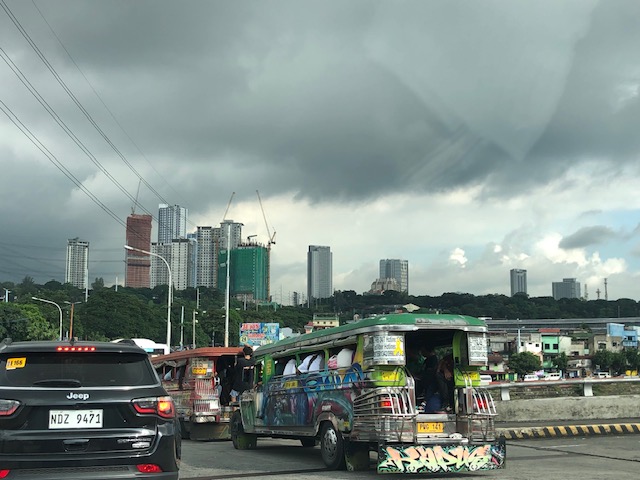 I took this photo while stopped in traffic at the SM Marikina service road one morning. I have been commuting along this route since the late 1980s and at that time, there were no tall buildings along Katipunan. However, traffic was already bad especially along the stretch from Aurora Boulevard to C.P. Garcia. Its worse now from what I have observed and experienced these 35 years.
There will likely be more condos to be built in that area. The question is if these will lead to more people walking, cycling or using public transport, and becoming less car-dependent. What are the travel characteristics of people there? How much is through traffic?
–
On reducing vehicle travel
This Sunday, I am sharing this article on the reduction of excess vehicle travel. I noted the use of the word ‘excess’ here, which somewhat distinguishes what is excess from what is necessary vehicle (or car) use.
Litman, T. (September 8, 2023) “How to reduce excess vehicle travel,” Planetizen, https://www.planetizen.com/blogs/125445-how-reduce-excess-vehicle-travel?utm_source=Planetizen+Updates&utm_campaign=b3ced8c873-EMAIL_CAMPAIGN_2023_08_09_05_38_COPY_01&utm_medium=email&utm_term=0_-6cce27a957-%5BLIST_EMAIL_ID%5D&mc_cid=b3ced8c873&mc_eid=9ccfe464b1 [Last accessed: 9/17/2023]
To quote from the article:
“Too often, practitioners undercount and undervalue slower but more affordable, inclusive, and resource-efficient modes such as walking, bicycling, and public transit. This contributes to the self-reinforcing cycle of automobile dependency and sprawl, illustrated below. We have an opportunity to break this cycle by recognizing the unique and important roles that walking, bicycling, and public transit can play in an efficient and equitable transportation system, and the cost efficiency of vehicle travel reduction policies. Telework can help, but only if implemented as part of an integrated program to create a more diverse, efficient and equitable transportation system.”
There is a lot you can pick up from this article, which sheds a light of hope towards addressing the most pressing issues particularly for our daily commutes. Litman is always clear and evidence-based for his discussions. His arguments are very persuasive if only decision-makers are not resistant to the facts about transport.
–
Inflight meals onboard AirAsia flight MNL-KUL
Airline food is probably among the most maligned among meals. You’ve probably read or heard about complaints on meals served on board aircraft; especially those on Economy Class or coach. You have to be in Business Class or First Class to be served good meals or sets. If you are not the picky kind, then you will likely find the simply joys with the meals served on low cost carriers. These are usually selected and paid for in advance though you can also order in-flight assuming they carry all those items on their menu. Here are some items with AirAsia’s Santan:
 Promotion of in-flight meals on AirAsia
 The Chicken Rending and Vegetable Curry meals look good on paper.
 So are the Chicken Biryani and Vegetable Biryani meals.
 The Chicken Rice and Thai Basil Chicken dishes are also familiar to me. I wondered if the airline got these right and if they would be satisfying to passengers choosing these on-board or perhaps pre-ordering them.
 Nasi Lemak sounded familiar and was perhaps something we tasted when we were still residing in Singapore.
 There’s a vegetarian or plant-based version of this dish.
 I settled for something familiar and enjoyable to me – Chicken Satay
 The rice was curiously prepared and served similar to the ‘puso’ found in the Visayan and Mindanao provinces of the Philippines.
To cut the story short, I enjoyed my simple meal on-board AirAsia. I would dare say that I found my meals on this airline better than what I have eaten on-board Cebu Pacific. The meals also were better than what we recently had on board Philippine Airlines. That says a lot considering PAL is a full service airline. Of course, the meals on board Singapore Airlines and Thai Airways are would be tops on my list even in Economy Class.
Something I wanted to write about is my take on airline food over the years. I have a good memory of my first airline meals on board PAL in the 1970s. And I have had my fair share of various airline meals including First and Business Class meals on various airlines. That should be fun to write about!
–
First impressions of a country or city – Kuala Lumpur
I recently traveled to Malaysia and just making this quick post of first impressions based on one of its gateways – Kuala Lumpur International Airport. This was not my first trip to Malaysia as I traveled there before but by land and from Singapore (we were residing in Singapore). That time, I traveled to Melaka. Here are photos when we arrived in KLIA last weekend.
 |
| A view of KLIA Terminal 2 as our plane approached to land |
 |
| Two towers – air traffic control towers, that is. The closer one is Terminal 2’s while the one at the distance is Terminal 1. |
 |
| A view of Terminal 2 as our plane taxied to the terminal |
 |
| Terminal 2 is designated for low cost carriers, and is the hub of AirAsia. This terminal replaced the low cost carrier terminal at KLIA, similar to what also happened in Changi. |
 |
| Our plane berthed at the satellite building. This meant we had to walk to the bridge to cross to the main Terminal 2 building. The two buildings are not served by a transit system like KLIA Terminal 1 (or HKIA or Changi, for example). |
 |
| The view of our plane as we crossed on the bridge to the main terminal building. |
 |
| AirAsia planes lined up along one of wings of the satellite building. Each wing is essentially a long pier. |
I was impressed by how large and spacious Terminal 2 is. It is designed, after all, to serve the millions of travelers going through this gateway in what is Southeast Asia’s most visited country for tourists. I just thought though that the moving walkways seemed to be an afterthought and that it was a long walk (healthy though) for many people between the main and satellite buildings. Terminal 2 though is located far from Terminal 1 so transport is required in case you need to transfer from one terminal to the other. It is not as seamless as Changi, for example. Still KLIA is much better than many capital city airports that I’ve been to though there is room for improvements.
–
Another look at the Mactan Cebu International Airport Terminal 1 – Part 3
This is the conclusion to the series on MCIA Terminal 1. Here I am sharing more photos of the shops and also include photos of what used to be the old terminal 1 boarding gates areas that have now been completely renovated.
 Electronics shop at the MCIA Terminal 1
 There’s a sports bar at Terminal 1
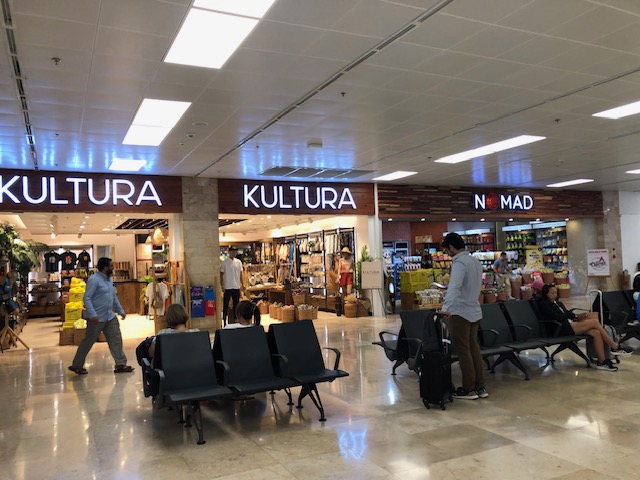 There’s a Kultura shop at the Terminal 1. Kultura is SM’s
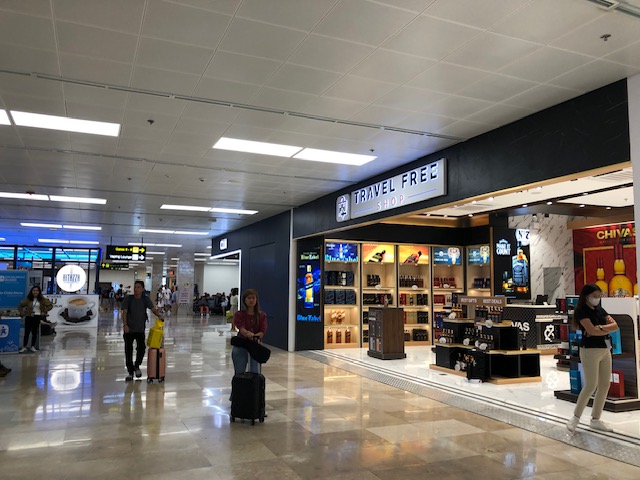 Liquors and wines store at the terminal – I was not able to inquire if these can be duty free considering the people including foreign tourists who may avail of this.
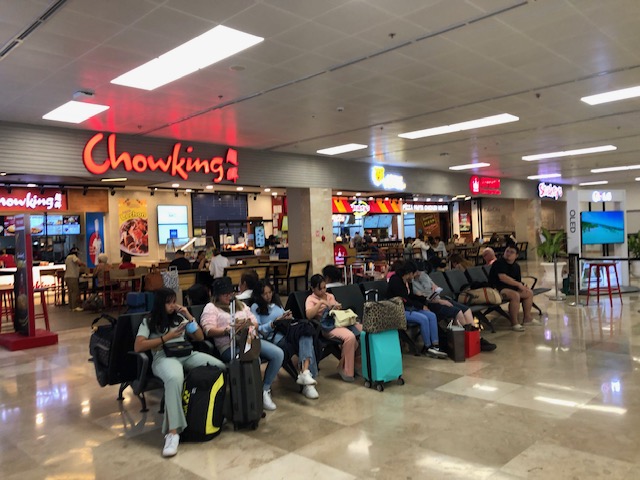 Passengers seated along a row of restaurants at the old Terminal 1 domestic wing. This area used to be crowded with so many chairs that they tried to fit in the area.
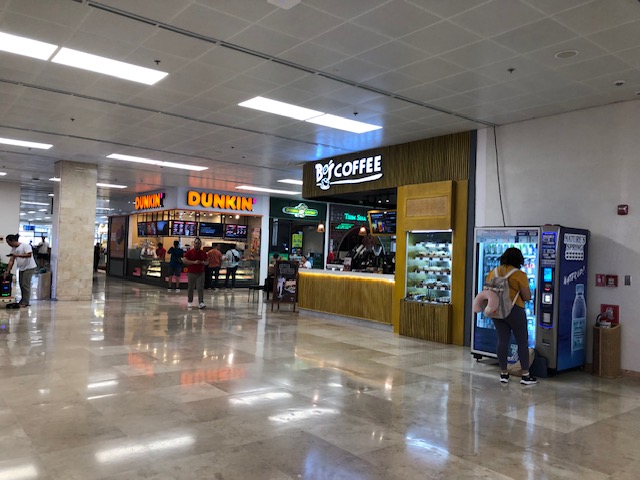 Familiar brands Dunkin’ Donuts and Bo’s Coffee are there. There are also vending machines for drinks for the more straightforward purchases.
 The pre-departure area of the old T1 domestic wing now appears more spacious.
 Corridor to the old T1 domestic wing now full of shops
More on airports soon!
–
Musings on rainy day commutes
I sympathize with a lot of people whose activities were disrupted by the inclement weather the past days. The rains from the other night and today resulted in floods around Metro Manila and Rizal (where I live). The forecast of more rains during the past days made government suspend classes at all levels for both public and private schools. However, many and particularly students have already traveled to their schools as some announcements came late or not early enough for those who usually leave home early to avoid the usual traffic congestion around schools.
I myself used to leave our home early to go to school. As I took public transportation to the university, I had to leave before 6:00 AM (even earlier if it was raining) to be able to get a jeepney ride and have a comfortable trip (shorter travel time than when I leave later in the morning). I had one transfer at what used to be the K-Mart terminal. Both legs of the trip were via jeepneys. I recall silently cursing the guards at Ateneo for prioritizing what seemed to be an infinite number of cars entering and exiting that university via their Gates 2 and 3. At the time, Ateneo still operated the blue school buses and you can see few students on those buses. I observed already then that most of their students probably had their own vehicles to take them to school. Once past the gauntlet of Ateneo and Miriam (which was Maryknoll before), traffic was smoother. And to think that there was no C.P. Garcia yet and Katipunan at the UP Diliman and MWSS areas was not as wide as it is now. The old Katipunan section was basically a two lane road with UP on one side and MWSS on the other. What is now a center island with large acacia trees used to be the frontage of MWSS. UP’s walls were lined with eateries and small stores catering to students and workers.
My commutes during the wet season can be quite difficult as you can’t simply hang on to the jeepney (at the back) when it’s pouring. And when the weather’s particularly bad, there were flooding along my route, not to mention where I resided. I also remember wading in floodwaters along Katipunan (yes, there were floods along Katipunan before) because the road was impassable to vehicles and the only way to get home was to walk from UP to Aurora Boulevard. Our home in Cainta was often flooded during typhoons, and I also waded in floodwaters along portions of Felix/Imelda Avenue an in our village. The flood experiences probably deserve separate articles here and I will share some stories as soon as I can organize my thoughts and memories of these. Of course, I will relate these to transportation as there were lots I learned from these experiences. The frustration though is that it seems we have yet to do in order to address climate’s and weather’s impacts on transportation.
–
On the benefits of walkable communities to pregnant women
I break the series on MCIA Terminal 1 to share this interesting article relating walkable communities to healthier pregnancies:
To quote from the article:
“The study, published in the journal of Economics and Human Biology, found that expectant mothers living in walkable counties tend to engage in more walking and exercise and have fewer issues with premature births, low birth weight, gestational diabetes and hypertension. Walking is often recommended as a safer, more moderate activity for pregnant women, so the authors reasoned that living in a more walkable area could have health benefits for them.”
If you’re interested in the details of the study referred to in the article, here is the link to the paper entitled “You’ll never walk alone – the effects of walkability on pregnancy behaviors and outcomes” in the journal Economics & Human Biology:
https://doi.org/10.1016/j.ehb.2023.101269
–
Another look at the refurbished Mactan International Airport Terminal 1 – Part 2
In this part of the series, I am sharing photos of the various shops and eating options at the MCIA Terminal 1.
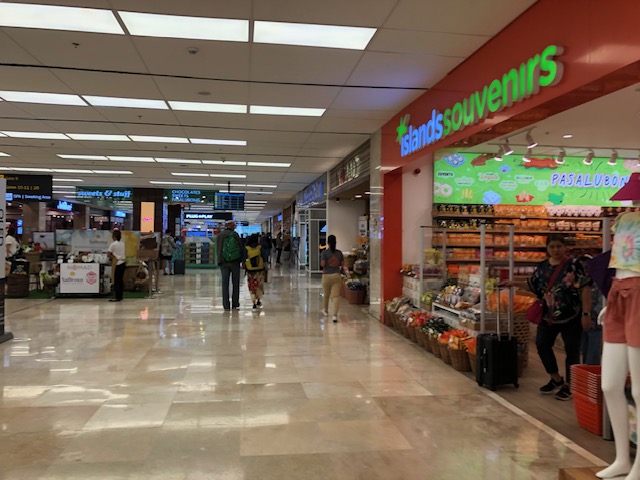 A familiar store at airports is Islands Souvenirs. I think I have an Island Souvenir shirt for most of the cities I’ve traveled to in the country. It is a go-to store for souvenir items, especially shirts.
 There are many kiosks along the corridors leading to the gates. Some sell souvenir items. Others gadgets and accessories. There are even a couple marketing real estate in Cebu.
 A look inside the Islands Souvenirs shop shows many items to choose from including shirts, bags, caps, mugs and magnets.
 I think this store was what used to be a Cocoa Tree store at the terminal. It still sells pretty much the same products (mainly chocolates).
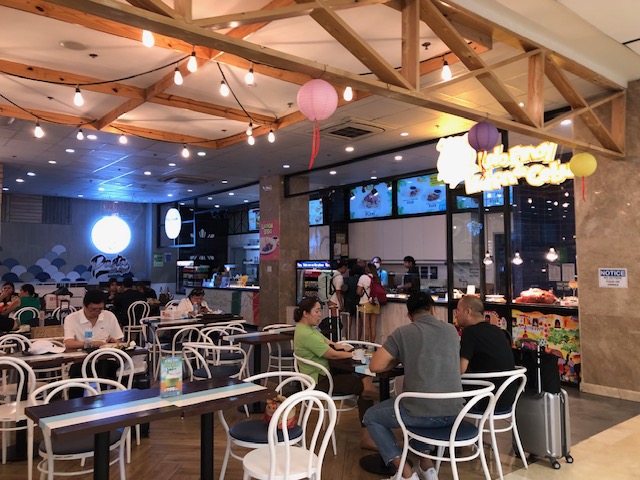 There is a nice food court at Terminal 1. You have many choices for eating or drinking. And I noticed the prices are also not as expensive as perceived of Philippine airport food and drinks.
 The food court is spacious and people can just stay here for refreshments while waiting for their flights to board.
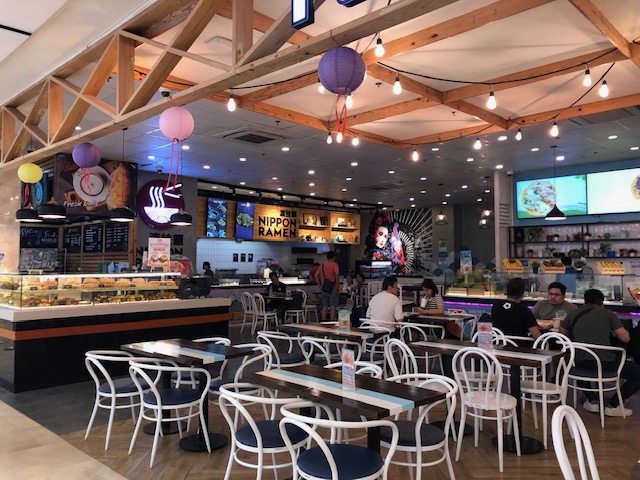 Aside from Filipino food, there’s Italian and Japanese themed stalls at the food court.
 I think my favorite there is The Bakery, which offers sandwiches, pastries and various breads. They also have pasta for those wanting a heavier meal before their flights.
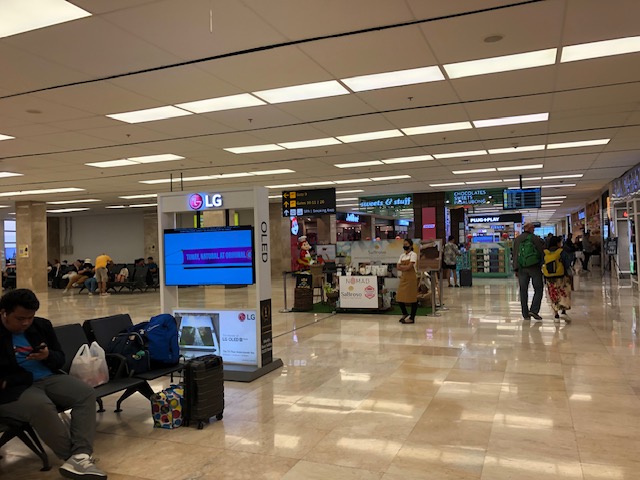
 There’s a WHSmith store at Terminal 1. The photo also shows massage chairs and a local souvenir shop, District Fiesta.
 District Fiesta offers local products including handicrafts like bags, purses, decors, etc.
More in Part 3, coming soon!
–
