
Home » Behavior (Page 13)
Category Archives: Behavior
On e-scooters
One of the so-called new mobility modes is the e-scooter. It is categorized as a micro mobility mode and in appearance is no different from a kick scooter with the difference lies in the former being motorized. Not all are powered by electric motors as I’ve seen ones that are gas-powered (small internal combustion engines). The latter are noisy and have emissions but seem to be more powerful especially when encountering inclined road sections (e.g., going up to Ortigas Center from C5, going up to Antipolo). Some seem to be customized for more power as I’ve seen motorcycle shops doing what looks like modifications and not just repairs.

I’m sharing an article below about e-scooters and their involvement in road crashes in Europe:
Meaker, M. (December 7, 2021) “E-scooters are everywhere in Europe. So are grisly accidents,” Wired, https://www.wired.com/story/escooters-accidents-europe/?bxid=5bd6761b3f92a41245dde413&cndid=37243643&esrc=AUTO_OTHER&source=EDT_WIR_NEWSLETTER_0_DAILY_ZZ&utm_brand=wired&utm_campaign=aud-dev&utm_content=WIR_Daily_120721&utm_mailing=WIR_Daily_120721&utm_medium=email&utm_source=nl&utm_term=P4 [Last accessed: 12/9/2021]
I think the proverbial jury is still out there in as far as these vehicles are concerned. Safety-wise, there should be concern if users speed up and zig-zag through traffic. These are the same concerns in the European cities mentioned in the article. Personally, I don’t see these vehicles gaining as much popularity for typical commutes compared to the bicycle, which has seen a surge in use during this pandemic and with bike lanes (pop-up and permanent) in place in many areas. These same bike lanes are now also being shared by these e-scooters. I think more people will opt for the motorcycle, which comes in different sizes and engines, and which provides more in terms of versatility of use. But again, there are risks involved here and perhaps some e-scooter users are mimicking the undesirable, risky motorcycle rider behavior. Are they e-scooter users to be regarded and treated as drivers or riders considering they are using motorized vehicles? Perhaps the government should be working on this and other relevant, current policy (if not regulations) to e-scooter use.
–
Safety remains a big issue in transportation
Even with the supposedly reduced traffic due to the pandemic, there has been a perceived increase in the road crashes. Many of these are speeding and reckless driving/riding related, and many involve pedestrians and cyclists who are most vulnerable considering the reckless behavior of drivers and riders. Following are photos taken in Antipolo along Ortigas Avenue Extension (the section leading up to the capitol):


Much has been said and written about Philippine roads not being up to par with international standards. I would agree with certain roads with designs encouraging speeding and other reckless behavior. However, there have been significant efforts to correct situations involving geometric design, signs and markings where applicable. These include engaging the International Road Assessment Program (iRAP). The road and engineering are just one part of the equation. Education and enforcement are the others that affect or influence the behavior of road users whether they be drivers, riders, cyclists or pedestrians. Even with the best road designs and their intended influence to driver and rider behavior, much is to be desired for driver/rider education and actual behavior on the road.
–
Vaccines for road safety
If there is the current vaccination drive vs. Covid-19, there is also something like this for road safety. The International Road Assessment Program (iRAP) developed many tools and resources to address road safety issues. I am sharing the link to the Vaccines for Roads site of iRAP here:
Because Every Life Counts
It is always good to know about these resources whether you are a practitioner, a researcher. a teacher or perhaps an advocate of road safety. There are many examples here of interventions for various scenarios or conditions that will hopefully lead to safer roads for all.
–
On the key transformations needed to achieve sustainable, low carbon transport
Also related to COP26, I am sharing material from the Sustainable Low Carbon Transport (SLOCAT) partnership, of which our center is part of. SLOCAT recently released the 11 key transformations for sustainable low carbon land transport urgently needed to meet the climate targets. Here’s a link to their site:
SLOCAT also has the following Wheel of Transport and the Sustainable Development Goals (SDG’s) on the same site. The Wheel illustrates the four cross-cutting themes: equitable, healthy, resilient and green.
In the SLOCAT site, they list the following to support the transformations:
Overarching approaches to apply across transport modes and sub-sectors overtime
- Put people first, not vehicles and technology
- Co-create and communicate a compelling vision and targets
- Guide short- and medium-term action with clear, coherent political messages
- Combine push and pull measures: Regulate and incentivise
- Link policies within and beyond transport for synergies
- Prioritise resources by social and sustainable value for money
- Engage, empower and coordinate stakeholders across government levels and sectors
- Build capacity and improve data
- Implement pilots to learn and share, then roll out at scale
–
Safe streets for children
We have been working with UNICEF and several partner organizations on a project on Child Road Traffic Injury Prevention (CRTIP). The Final Reports for the two pilot cities, Valenzuela City and Zamboanga City, have been submitted and represents over 2 years work including during the lockdowns due to the Covid-19 pandemic. The latter part of project implementation indeed became a challenge as we couldn’t travel and engage face-to-face or conduct field surveys like how we did in the first part of the project. Still, I believe we were able to accomplish much and most of what we initially set out to do. Here are the covers of the Final Reports we submitted to UNICEF and we understand will be officially or formally transmitted to the two cities.


The reports narrate the surveys conducted for 25 schools in Zamboanga and 41 schools in Valenzuela. Each initially had selected 25 schools but Valenzuela pushed for an additional 16 schools midway into the project. The SR4S tool developed by iRAP was used for the assessments of critical areas around the schools. The initial assessments were used to identify interventions to improve safety in these areas and recommendations were submitted for consideration of the cities as well as the DPWH where applicable (i.e., the DPWH has jurisdiction over national roads and improvements proposed along these). While some interventions were implemented, others and many were delayed mainly due to Covid-19.
We also conducted a survey to determine the commuting characteristics of schoolchildren in both cities. Since most schools were public schools, it was no surprise that most children lived near the schools or within the school district (which is basically the catchment area for these schools). Thus, it also came as no surprise that most schoolchildren came by foot (walking), motorcycles (riding with a parent) or motor tricycle. There’s a lot of information and takeaways from the data but unfortunately, we could get the bigger, more complete picture of Valenzuela City because they selected only elementary schools covering students from Grades 1 to 6. Zamboanga had a more robust data set with both elementary and high schools, covering Grades 1 to 12. The information derived from these surveys were also analyzed and related to the SR4S assessments. The commuting survey results and SR4S assessment are subject of two technical papers presented in the recent EASTS 2021 conference hosted by Hiroshima University.
What’s next? We are now drafting a proposal for a Phase 2 of the project. We hope to continue and reinforce and follow-up on the recommended interventions from Phase 1. We also hope to be able to work on the CRTIP data hub that was only partly completed due to the many constraints faced by that part of the project. I will post here from time to time about some of the outcomes from the surveys and assessments.
–
On why people are afraid to bike
There is an interesting graphic shared by a friend on his social media account. I am also sharing it here. The source may be found at the bottom right of the graphic.

I think the graphic speaks for itself. How can we encourage people to bike whether for commuting or other utilitarian purpose if there are nuts behind the wheels of many motor vehicles? All the points raised in the graphic are true for the Philippines and are not limited to drivers of private vehicles. These are also the same for public transport drivers as well. And these cannot be solved or addressed overnight. You have to get to the roots of the problem, which are about the driver and rider education (i.e., training), and the licensing system of the Land Transportation Office (LTO).
While there are driving and riding schools that have proliferated, many seem to just go through the motions of driver and rider education. Prospective motor vehicle drivers and riders often just learn enough to pass a flawed examination to get their licenses. Do they really learn about how to behave properly when driving or riding? It certainly does not show with how they deal with cyclists and pedestrians. As for enforcement, well that’s another topic to discuss in a separate post.
–
On quantifying the benefits of bike share
I’m sharing another article that presents a quantification of Such articles and studies are gaining interest as cycling or biking becomes a popular choice for many seeking an alternative to their usual or former modes of transport. It helps that there are many initiatives promoting active transport in general and cycling/biking in particular.
Wilson, K. (July 23, 2021) “Study: Bike Share Saves the U.S. $36 Million Public Health Dollars Every Year,” StreetsBlog USA, https://usa.streetsblog.org/2021/07/23/study-bike-share-saves-the-u-s-36-million-public-health-dollars-every-year/ [Last accessed: 8/6/2021]
While the article is about bike share, the conclusions can be extended to cycling/biking in general. The article points to at least 3 major areas where benefits can be derived: safety, air pollution (reduction) and physical activity. To quote:
“I think the message to cities is that bike share — and biking in general, though that’s harder to quantify in the way we do in this study — can contribute a lot to their long term goals,… Most cities want to improve quality of life, the economy, the climate, and their public health outcomes. Bike share does all those things.”
–
On riders’ perception of safety
The Federal Highway Administration (FHWA) of the US Department of Transportation released some infographics recently to highlight road safety. One very timely and relevant graphic image asks about which facilities make bicycle riders feel safer:

There were some initial reactions when I shared this on social media with one immediately criticizing share-use paths and citing the one along Marcos Highway (stretch under Pasig, Marikina, Cainta and Antipolo) as an example. I quickly explained that the graphic assumes good designs instead of the flawed one along Marcos Highway. In fact, the shared use path is also quite popular in Europe and particularly in the Netherlands where they have many examples of these paths stretching for kilometers that are exclusive to active transport (pedestrians and cyclists). The good designs need to be shared and circulated so people will know about what they look like and learn about their features. These can be adopted and adapted to local situations.
Did you notice the images of cyclists/riders at the top of the graphic? These are important, too, because they provide context in terms of the type of riders who are the targets for infrastructure and campaigns that support and promote cycling across different types of people. Cycling shouldn’t just be for the most fit or the weekend warriors but rather for everyone who could take it up and not just for recreation but for everyday, utilitarian use (e.g., commuting, shopping, etc.).
On phantom congestion
I’ve talked about phantom congestion in my class lectures and training modules but have always explained it through figures and diagrams I usually draw on the board as I discuss the topic with my students or trainees. Here is a very informative, very visual explanation of what typically happens along many roads and how there is congestion when there seems to be no reason at all for these traffic jams:
Have you experienced these phantom traffic jams yourself?
–
Another look at the ‘avoid, shift and improve’ framework
The transport and traffic situation during this pandemic has revealed a lot about what can be done and what needs to be done about transportation. Discussions about what and how people visualize their ideal or acceptable transportation system reminded me of the backcasting concepts and the tools. The following diagram is sourced from the SLoCaT homepage: https://tcc-gsr.com/global-overview/global-transport-and-climate-change/
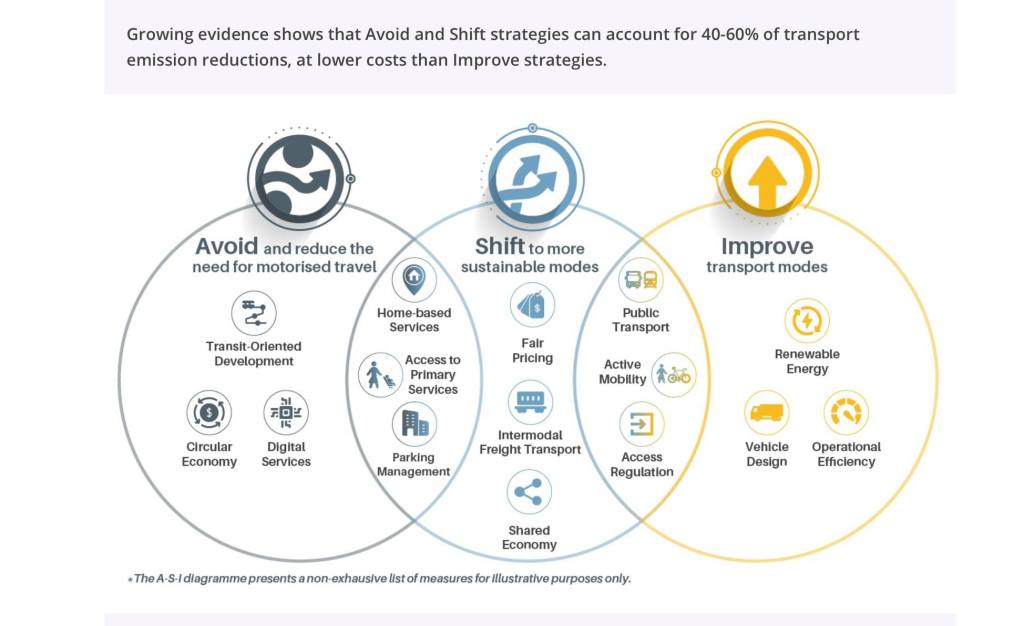
Note the overlaps among the three? Do you think its possible to have a measure that’s avoid, shift and improve at the same time?
Note, too, that if we contextualize this according to the Covid-19 pandemic, these measures even make more sense rather than appear like typical, ordinary measures we have about transportation. The pandemic revealed many weaknesses or vulnerabilities of our transportation system. We are presented with the opportunity to address these and implement certain measures that would have met with a lot of opposition before but can probably be rolled out now such as public transport priority schemes and protected bike lanes. “Work from home” is not really new since the concept has been proposed and implemented before but not as widely as was required by the pandemic situation. So perhaps we should take advantage of this forced reboot of sorts for our transportation system to be able to implement this A-S-I framework.
–
