
Home » EST (Page 14)
Category Archives: EST
On the 12 global road safety performance targets
The UN recently released the Global Plan for Road Safety. I’m just sharing their graphic on the global road safety performance targets:

I will try to discuss each one in future posts especially as I am involved one way or another in trying to realize these targets. Note, too, that these targets are further categorized among the five pillars mentioned at the foot of the graphic. These are (1) Road safety management; (2) Safer roads and mobility; (3) Safe vehicles; (4) Safe road users; and (5) Post-crash response.
–
We need to do more to reduce transport emissions
I did some work on long term action plans on low carbon transport for the ASEAN region before. We were able identify many of interventions that were being implemented as well as those that can be done to reduce transport emissions. Such reductions for the region would ultimately contribute to alleviating global warming. Unfortunately, while ASEAN is a significant contributor to emissions, it pales in comparison to emissions by individual countries like China and the US. If these two and others in the industrialized world do not commit to reducing their emissions, all work will come to naught. Here is an article that serves as a pre-event write-up for COP26, a major climate summit that will be held in Glasgow in the coming days.
–
Safe streets for children
We have been working with UNICEF and several partner organizations on a project on Child Road Traffic Injury Prevention (CRTIP). The Final Reports for the two pilot cities, Valenzuela City and Zamboanga City, have been submitted and represents over 2 years work including during the lockdowns due to the Covid-19 pandemic. The latter part of project implementation indeed became a challenge as we couldn’t travel and engage face-to-face or conduct field surveys like how we did in the first part of the project. Still, I believe we were able to accomplish much and most of what we initially set out to do. Here are the covers of the Final Reports we submitted to UNICEF and we understand will be officially or formally transmitted to the two cities.


The reports narrate the surveys conducted for 25 schools in Zamboanga and 41 schools in Valenzuela. Each initially had selected 25 schools but Valenzuela pushed for an additional 16 schools midway into the project. The SR4S tool developed by iRAP was used for the assessments of critical areas around the schools. The initial assessments were used to identify interventions to improve safety in these areas and recommendations were submitted for consideration of the cities as well as the DPWH where applicable (i.e., the DPWH has jurisdiction over national roads and improvements proposed along these). While some interventions were implemented, others and many were delayed mainly due to Covid-19.
We also conducted a survey to determine the commuting characteristics of schoolchildren in both cities. Since most schools were public schools, it was no surprise that most children lived near the schools or within the school district (which is basically the catchment area for these schools). Thus, it also came as no surprise that most schoolchildren came by foot (walking), motorcycles (riding with a parent) or motor tricycle. There’s a lot of information and takeaways from the data but unfortunately, we could get the bigger, more complete picture of Valenzuela City because they selected only elementary schools covering students from Grades 1 to 6. Zamboanga had a more robust data set with both elementary and high schools, covering Grades 1 to 12. The information derived from these surveys were also analyzed and related to the SR4S assessments. The commuting survey results and SR4S assessment are subject of two technical papers presented in the recent EASTS 2021 conference hosted by Hiroshima University.
What’s next? We are now drafting a proposal for a Phase 2 of the project. We hope to continue and reinforce and follow-up on the recommended interventions from Phase 1. We also hope to be able to work on the CRTIP data hub that was only partly completed due to the many constraints faced by that part of the project. I will post here from time to time about some of the outcomes from the surveys and assessments.
–
On Transit, Urban Equity and Sustainability
Here is another quick share of an article about public transport, urban equity and sustainability:
Descant, S. (September 2021) “How Can Transit Deliver Urban Equity and Sustainability?”, Government Technology, https://www.govtech.com/transportation/how-can-transit-deliver-urban-equity-and-sustainability [Last accessed: 9/21/2021]
The article discusses how the Covid-19 pandemic clearly shows the role of public transportation in the lives of a lot of people. There is that opportunity to significantly if not radically improve public transportation now more than ever. Surely governments and their transit or regulating agencies have thought about this. While the pandemic led to situations that are not necessarily clean slates for many, there are definitely opportunities here and there to implement change that will increase benefits for transit users while attracting non-users to shift from their preferred modes (i.e., private vehicles). Here’s a takeaway from the article:
“We know that public transportation is the solution. So there needs to be a commitment at the federal level, not just in terms of funding, but also integrating public transportation deeper into the fabric of society, through land use policy and through other transportation access policies — the sidewalk and bike lane piece — with the data and payment apps as well…”
What improvements do you think should and can be done now given the pandemic situation? Are these still timely or have we figuratively “missed the bus”, so to speak?
On electric vehicles in the Philippines – current situation and prospects
Here’s a quick share of an article on electric vehicles in the Philippines:
Fernandez, H.A. (September 7, 2021) “Electric vehicles in the Philippines: a mottled green solution,” Eco-Business, https://www.eco-business.com/news/electric-vehicles-in-the-philippines-a-mottled-green-solution/ [Last accessed: 9/8/2021]

It is interesting that the article cites past studies that covered not just e-vehicles but the bigger picture for transport. I think most if not all people who were doing work on low carbon transport including the modeling of scenarios for the long term were not able to anticipate something like Covid-19 disrupting activities around the world and curbing emissions so drastically in the last year. The so-called ‘old normal’ situation has not returned but some say that even with the pandemic affecting transport, we still won’t be able to attain the targets necessary to stave off global warming. The bottomline is that we need more aggressive actions and probably, shifting to e-vehicles is one of those that combined with others will help achieve targets.
–
On priority lanes for public transport
I am currently part of an International Research Group (IRG) involved in studies on bus priority. Yesterday, we had a meeting where one professor mentioned the importance of being able to clearly explain the advantages of having priority lanes for buses in order to improve their performance (i.e., number of passengers transported and improved travel times). There was a lively discussion about how the perception is for bike lanes while transit lanes have also been implemented for a long time now though with mixed results.
There are very familiar arguments vs. taking lanes away from cars or private motor vehicles and allocating them for exclusive use of public transport and bicycles. It may sound cliche but ‘moving people and not just cars’ is perhaps the simplest argument for priority lanes.
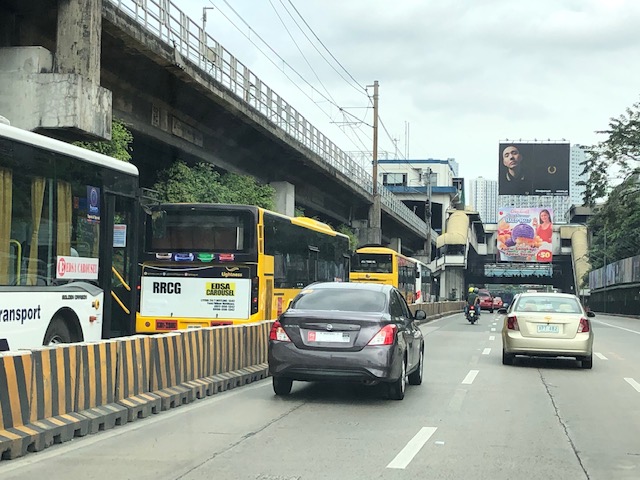 EDSA carousel buses lining up towards a station
 Bike lane along Katipunan Avenue – is this a temporary thing? a fad because traffic is really not back to the old normal? Katipunan is infamous for being congested with cars generated by major trip generators in the area such as schools/universities and commercial establishments.
 The bike lane along Commonwealth Avenue proves there’s just too much space for private motor vehicles. And with the Line 7 in the horizon, perhaps more lanes can be taken and made exclusive to road public transport. [Photo credit: Cenon Esguerra]
–
On defining the 15-minute city
I have shared articles and briefly written about the concept of the 15-minute city on this blog. Here is another discussing how a 15-minute city is defined:
(February 8, 2021) “Defining the 15-minute city,” Public Square, https://www.cnu.org/publicsquare/2021/02/08/defining-15-minute-city [Last accessed: 8/10/2021]
Here is an image from the article:
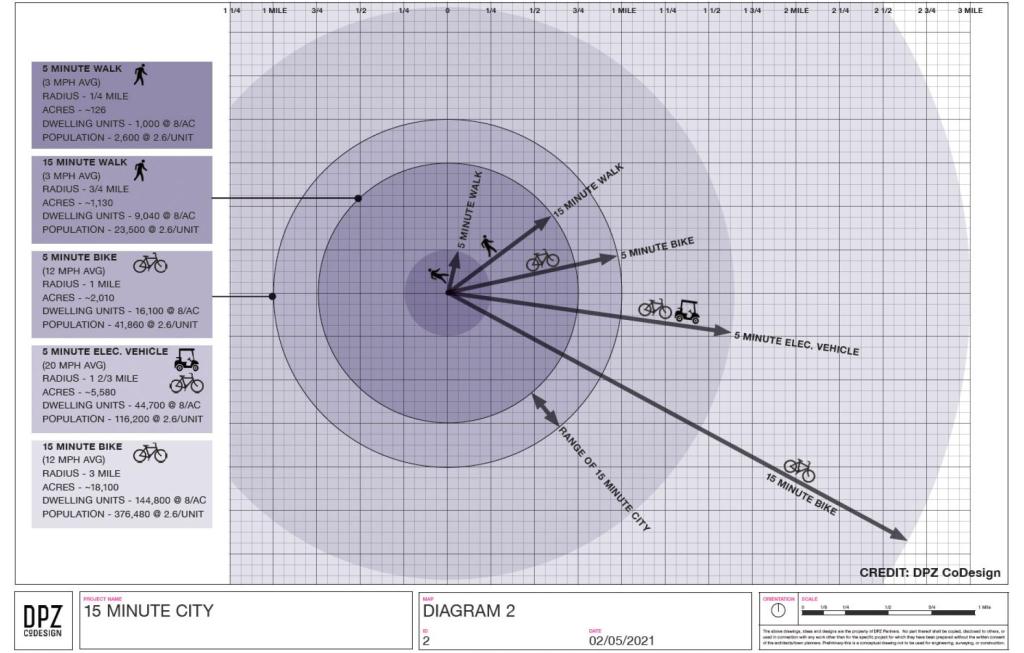
Again, it is important to contextualize these concepts. I share these as references and topics for discussion. Of course, I have my own opinions about this and I have written about those in previous posts. I guess in the Philippine context, we can include the pedicab or non-motorized three-wheelers in the discussion. These are also very popular modes in many cities and municipalities despite their being also prohibited along national roads like their motorized counterparts. It would be nice to have more visuals in the form of maps that show travel times for essential destinations or places like hospitals, markets, grocery stores, workplaces and, of course, homes. I assume there is at least someone, somewhere who perhaps have made multi-layer maps of this sort and attempted to related them along the lines of this concept of a 15-minute city (or perhaps the even older “compact cities”).
–
On quantifying the benefits of bike share
I’m sharing another article that presents a quantification of Such articles and studies are gaining interest as cycling or biking becomes a popular choice for many seeking an alternative to their usual or former modes of transport. It helps that there are many initiatives promoting active transport in general and cycling/biking in particular.
Wilson, K. (July 23, 2021) “Study: Bike Share Saves the U.S. $36 Million Public Health Dollars Every Year,” StreetsBlog USA, https://usa.streetsblog.org/2021/07/23/study-bike-share-saves-the-u-s-36-million-public-health-dollars-every-year/ [Last accessed: 8/6/2021]
While the article is about bike share, the conclusions can be extended to cycling/biking in general. The article points to at least 3 major areas where benefits can be derived: safety, air pollution (reduction) and physical activity. To quote:
“I think the message to cities is that bike share — and biking in general, though that’s harder to quantify in the way we do in this study — can contribute a lot to their long term goals,… Most cities want to improve quality of life, the economy, the climate, and their public health outcomes. Bike share does all those things.”
–
On riders’ perception of safety
The Federal Highway Administration (FHWA) of the US Department of Transportation released some infographics recently to highlight road safety. One very timely and relevant graphic image asks about which facilities make bicycle riders feel safer:

There were some initial reactions when I shared this on social media with one immediately criticizing share-use paths and citing the one along Marcos Highway (stretch under Pasig, Marikina, Cainta and Antipolo) as an example. I quickly explained that the graphic assumes good designs instead of the flawed one along Marcos Highway. In fact, the shared use path is also quite popular in Europe and particularly in the Netherlands where they have many examples of these paths stretching for kilometers that are exclusive to active transport (pedestrians and cyclists). The good designs need to be shared and circulated so people will know about what they look like and learn about their features. These can be adopted and adapted to local situations.
Did you notice the images of cyclists/riders at the top of the graphic? These are important, too, because they provide context in terms of the type of riders who are the targets for infrastructure and campaigns that support and promote cycling across different types of people. Cycling shouldn’t just be for the most fit or the weekend warriors but rather for everyone who could take it up and not just for recreation but for everyday, utilitarian use (e.g., commuting, shopping, etc.).
Another look at the ‘avoid, shift and improve’ framework
The transport and traffic situation during this pandemic has revealed a lot about what can be done and what needs to be done about transportation. Discussions about what and how people visualize their ideal or acceptable transportation system reminded me of the backcasting concepts and the tools. The following diagram is sourced from the SLoCaT homepage: https://tcc-gsr.com/global-overview/global-transport-and-climate-change/
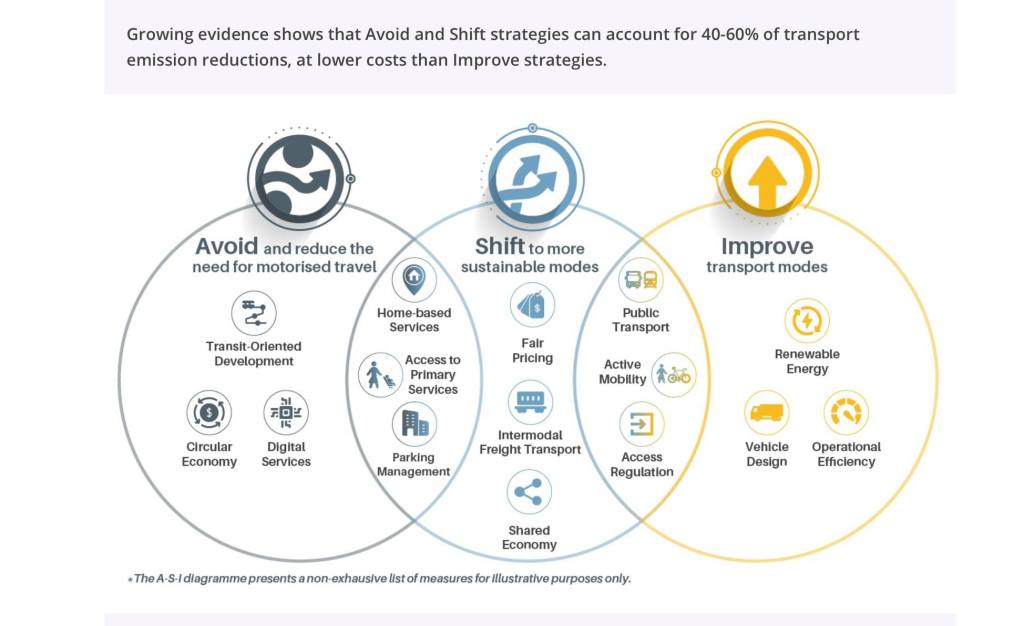
Note the overlaps among the three? Do you think its possible to have a measure that’s avoid, shift and improve at the same time?
Note, too, that if we contextualize this according to the Covid-19 pandemic, these measures even make more sense rather than appear like typical, ordinary measures we have about transportation. The pandemic revealed many weaknesses or vulnerabilities of our transportation system. We are presented with the opportunity to address these and implement certain measures that would have met with a lot of opposition before but can probably be rolled out now such as public transport priority schemes and protected bike lanes. “Work from home” is not really new since the concept has been proposed and implemented before but not as widely as was required by the pandemic situation. So perhaps we should take advantage of this forced reboot of sorts for our transportation system to be able to implement this A-S-I framework.
–

