
Home » EST (Page 7)
Category Archives: EST
Bike racks at SM City Taytay
I have written before about the bike facilities at SM malls. Their new malls and expansion projects already have provisions for bike parking in addition to motorcycle parking despite the building code not having provisions for these. I write about another example, this time in Rizal province. SM City Taytay has bike racks installed at the basement parking. I am sharing the following photos for reference.
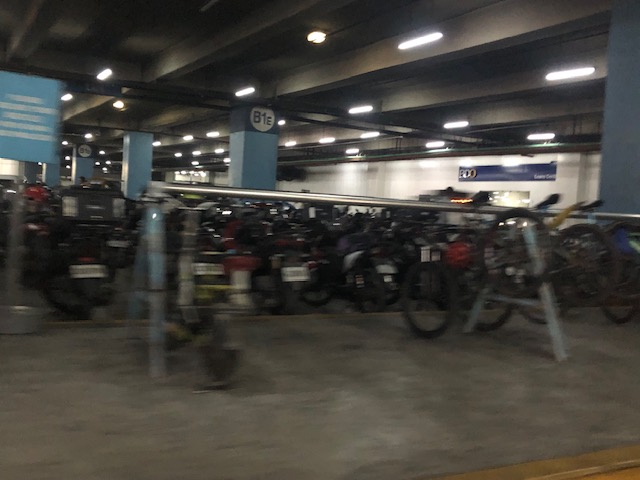 Hand rail/hanger type racks
 Bollard style racks
 Grid style racks
I’m not sure what went into the decision, if there was any, to provide different types or styles of racks for bicycle parking. To some, it looks like an afterthought rather than a planned approach to bike parking. Still, the facilities appeared to be highly utilized so that means people are taking their bikes to the the mall and it appears that most of these are customers rather than mall personnel. SM has been quite vocal and active in promoting their involvement in active transport (i.e., mostly about cycling) and their malls have included bike parking as an integral part of their facilities. Hopefully, they will continue to support cycling and develop better facilities to encourage bike use.
–
Incorporating bike lanes along local roads – an example in Taguig City
I have not used an old route that we usually take to go to BGC from our place in Antipolo. This is via the Manila East Road, Highway 2000, Barkadahan Bridge and C6. From C6, we usually take Ruhale instead of Seagull Avenue as the former provided a shorter route towards Levi Mariano Avenue and C5. So it was only last weekend that I was able to see the improvements along Ruhale Street and how bike lanes were incorporated along this road. I am sharing the following photos showing a two lane road and Class 2 bike lanes.
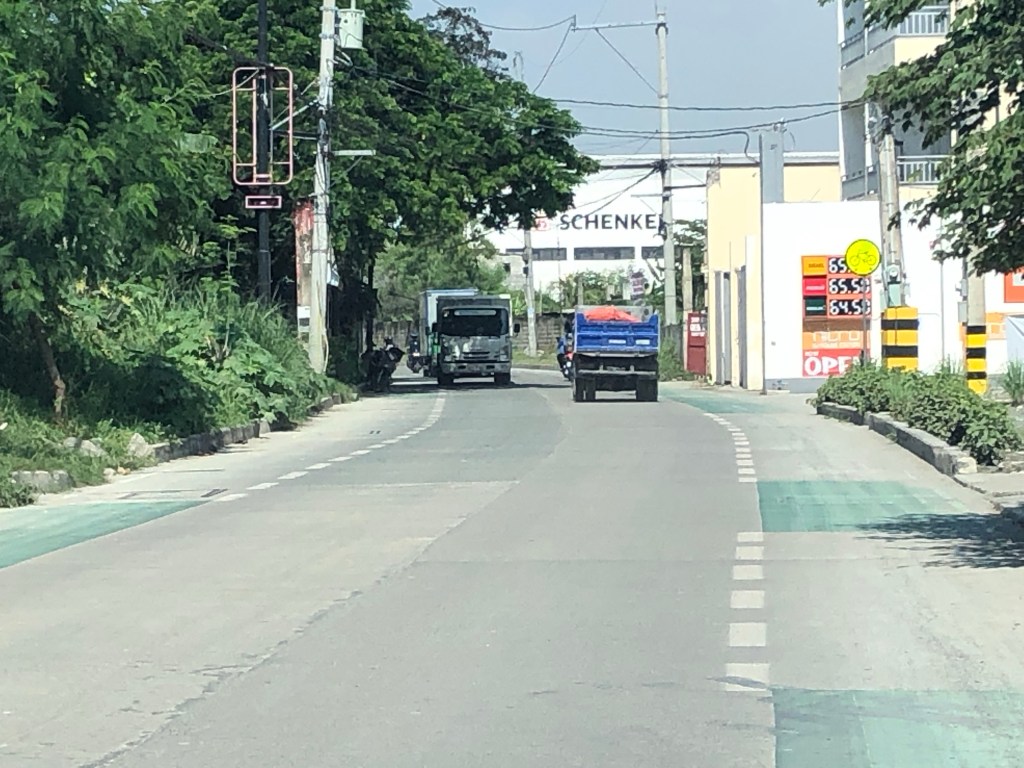 The green pavement markings indicate an intersection or driveway.
 Noticeable are the electric posts that remain along the bike lanes. These need to be transferred so they will not pose danger to all road users.
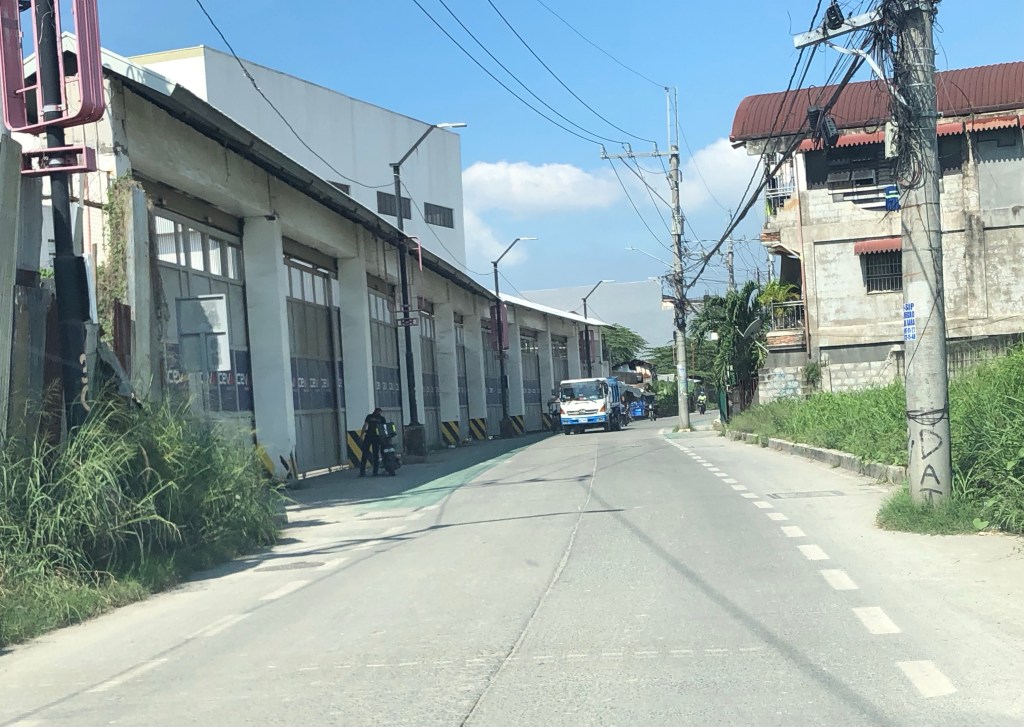 More electric posts along the bike lanes
 Bike lanes in front of an industrial establishment
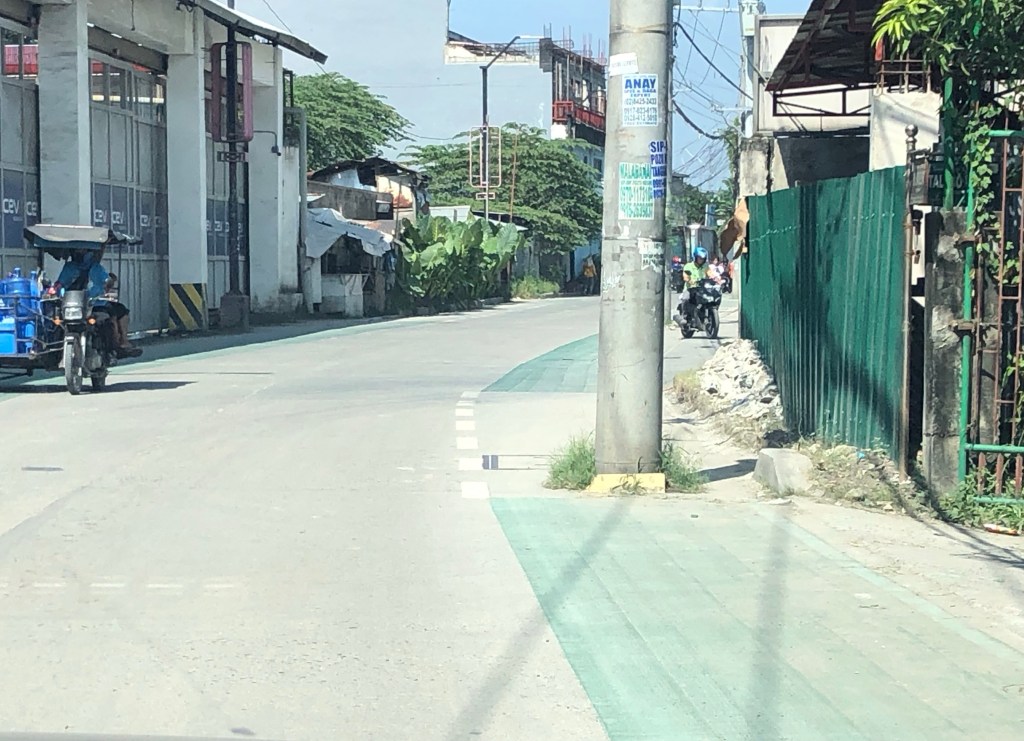 Close-up of a post in the middle of the bike lane.
 Bike lane across another industrial establishment. Again, note the green pavement marking across the driveway of the establishment.
 Bike lanes along a predominantly residential area along Ruhale.
I would consider this as a good practice example that can be replicated elsewhere. Of course, it is not perfect and as shown in the photos, there is much room for improvement including the transfer of electric posts that pose as hazards to all road users. The bike lanes are wide enough that installing bollards for the perception of physical protection vs. motor vehicles can be considered. Ruhale is generally a low speed, low volume road so perhaps the current state with no barriers would be enough for now. Also, we need to appreciate that these are already gains or wins in as far as active transport is concerned. A few years ago, this would not have been implemented by national or local governments.
–
On micro mobility use of low-income people
We conclude September 2023 with another article share. This time it is about how low-income people use micro mobility.
Wilson, K. (September 20, 2023) “Study: How Low-Income People Really Use Micromobility,” StreetsBlog USA, https://usa.streetsblog.org/2023/09/20/study-how-low-income-people-really-use-micromobility [Last accessed: 9/30/2023]
To quote from the article:
“Low-income people are using shared micromobility a lot like they use public transit, a new study finds — and researchers think cities should thoroughly embrace (and subsidize) the mode as part of the larger ecosystem of buses and trains.
Researchers at Monash University, using survey data from micromobility giant Lime users across all income levels in the U.S., Australia, and New Zealand, dug deeper into how low-income people uniquely use the company’s vehicles.
Participants in the Lime Access program, which grants discounts of around “70 or 80 percent” to riders who qualify, were significantly more likely to list essential reasons like “shopping” for groceries (35 percent) and “commuting” (31 percent) than non-Access riders, 11 and 21 percent of whom rode to complete errands or go to work, respectively.
The discount recipients were also highly unlikely to go use bikes and scooters for non-essential reasons like social outings (12 percent), “joy-riding” (9 percent) or exploring (2 percent), quashing the stereotype that all micromobility trips are spontaneously generated. And a whopping 44 perccent of their trips connected to a traditional transit ride, compared to just 23 percent of people who paid full price.ago
Perhaps the most surprising findings, though, were riders’ qualitative responses about what micromobility meant to them, and how their lives were made better by having access to affordable ways to get around without a car. Calvin Thigpen — director of policy research for Lime and co-author of the report — says he was particularly moved by the number of riders with invisible disabilities who said Lime Access helped them get where they needed to go, even when local transit schedules didn’t meet their needs.”
The study was made in the First World (i.e., US, Australia and New Zealand) so while the methodology is sound, the subjects (i.e., what they defined as low-income) are not quite the same as low-income people in low to medium-income countries. The poor in the latter countries have more difficult lives but then these countries may already have the modes for them to be mobile – paratransit. Motorized tricycles, pedicabs and motorcycle taxis have been operating in these countries way before the arrival (or definition) of micromobilities.
–
A real battle of Katipunan – the search for a transportation solution
Is it obvious that I was alluding to the classic match-ups of the two major universities – Ateneo De Manila University and the University of the Philippines Diliman – that are located along Katipunan Avenue for the title of this article? That is deliberate on my part as there is a ‘real’ battle along Katipunan Avenue, and it does not involve sports.
Following is a recent article from the Philippine Collegian that reports on the current state of traffic along the corridor:
https://phkule.org/article/971/private-cars-mainly-to-blame-for-katipunan-traffic-transport-experts
I have written before and many times about transport and traffic along Katipunan Avenue. This road has been part of my daily commute since 1988 when I was admitted to UP Diliman as a B.S. Civil Engineering major. Back then Katipunan was not as wide as it is now, especially along the section between UP Diliman and the MWSS complex. That section only had 2 lanes then. What is not a wide center island with large, old acacia trees used to be the frontage of MWSS. So now you can probably imagine how much land was ceded by MWSS for road widening.
I also wanted to write about Katipunan in part as a sort of farewell to the former MMDA Chair and Marikina Mayor Bayani Fernando (BF), who recently passed away. Much of how Katipunan looks like and the traffic situation today can be traced to what transpired during his time at MMDA. I will refrain from writing about this and him for now. I am actually thinking of writing a series about BF and his time as Mayor in Marikina, as MMDA Chair, and his brief stint as DPWH Secretary. This short article will do for now.
Article share: On the benefits of sidewalk networks
Here is another quick share of an article by Todd Litman on Planetizen. The article contains a lot of information or data about why we should be investing in sidewalks or pedestrian facilities (i.e., for walking).
Litman, T. (August 6, 2023) “Completing Sidewalk Networks: Benefits and Costs,” Planetizen, https://www.planetizen.com/blogs/124999-completing-sidewalk-networks-benefits-and-costs?utm_source=newswire&utm_medium=email&utm_campaign=news-08142023&mc_cid=cd3b2e2ba5&mc_eid=9ccfe464b1 [Last accessed: 9/23/2023]
To quote from the article:
“Walking is the most basic and universal travel mode, and sidewalks are the most basic walking infrastructure, but they are often overlooked and undervalued in transportation planning. Completing and improving sidewalk networks can help achieve many economic, social and environmental goals.
Recent case studies indicate that typical North American communities spend $30 to $60 annually per capita on sidewalks, and would need to double or triple these spending levels to complete their networks. This is a large increase compared with current pedestrian spending but small compared with what governments and businesses spend on roads and parking facilities, and what motorists spend on their vehicles. Sidewalk funding increases are justified to satisfy ethical and legal requirements, and to achieve various economic, social and environmental goals. There are several possible ways to finance sidewalk improvements. These usually repay their costs thorough savings and benefits.”
–
Another look at home location choices
I recently shared an article showing the results of a survey conducted in the US. That survey appears to show that Americans prefer sprawl. But that may be due to many factors including political leanings that are actually mentioned in the article. I share another article that appears to be a reaction to the first one.
Lewyn, M. (August 14, 2023) “Do Americans Really Prefer Sprawl?” Planetizen, https://www.planetizen.com/blogs/125112-do-americans-really-prefer-sprawl?utm_source=newswire&utm_medium=email&utm_campaign=news-08142023&mc_cid=cd3b2e2ba5&mc_eid=9ccfe464b1 [Last accessed: 8/16/2023]
To quote from the article:
“Why do these surveys yield such drastically different results? The Pew survey notes that 3/4 of rural respondents favor the less walkable alternative; thus, that survey was apparently designed to include a representative sample of Americans, including rural Americans who typically do live in very spread-out environments. It seems to me quite natural that rural Americans would prefer rural lifestyles.
But once rural respondents are excluded, the balance between sprawl and walkable communities in the Pew survey becomes almost a toss-up. 57 percent of urban respondents refer houses with smaller yards and more walkability, and an almost-equal percentage of suburban respondents prefer the opposite.”
Again, I wonder what would be the outcomes if a similar survey were done in the Philippines. Will it reveal preferences for single detached homes rather than condos? Who will prefer the latter or the former? What could be the factors affecting home location choices in the Philippines? Cost is definitely a major factor. Commuting times perhaps and even commuting costs? But how do people weigh these factors? And what other influences are there to the decisions to purchase homes?
–
On using Google Maps to determine the best route from the pollution perspective
I saw this article on digital maps (i.e., Google Maps) being used to determine the best route for traveling between an origin and destination on land. It is interesting because what we usually use as basis for selecting our routes (assuming we can do so since people taking public transport basically have fewer options due to PUVs having mostly fixed routes) are travel time, travel distance and travel cost. Here is the article discussing the addition of fuel efficiency and emissions to the criteria:
Calma, J. (July 25, 2023) “People are using Google Maps to cut down tailpipe pollution,” The Verge, https://www.theverge.com/2023/7/24/23805652/google-maps-fuel-efficient-routes-transportation-emissions [Last accessed: 7/29/2023]
To quote from the article:
“According to Google’s own analysis, many drivers are taking the path of least pollution in their cars. To calculate the tailpipe emissions that prevented, the company compared how much fuel Maps users likely consumed on the routes they drove to how much fuel they would have burned through had they taken the fastest route without its eco-friendly routing tool. The savings amounted to 1.2 million metric tons of avoided CO2 emissions between October 2021, when Google launched the tool, and December 2022.”
While this seems to be a first foray into the including of eco-friendly items in route choice, these items are already and actually included in many travel planners including those used by people selecting which flights to take. We probably just didn’t notice them before or the information were not explicitly stated or posted. Would this really affect or influence the way we travel like how it is reported in the article? Or do we continue to go with the usual and familiar routes?
–
Bike lane master plan for Metro Manila, Metro Cebu and Metro Davao
The Department of Transportation (DOTr) with support from the United Nations Development Program (UNDP) yesterday formally launched the Bike Lane Master Plan for Metro Manila, Metro Cebu and Metro Davao. Yesterday’s event was actually the third and last leg of presentations, which were also made in Cebu and Davao. Here are a few photos I got from the DOTr Facebook page (these are public):
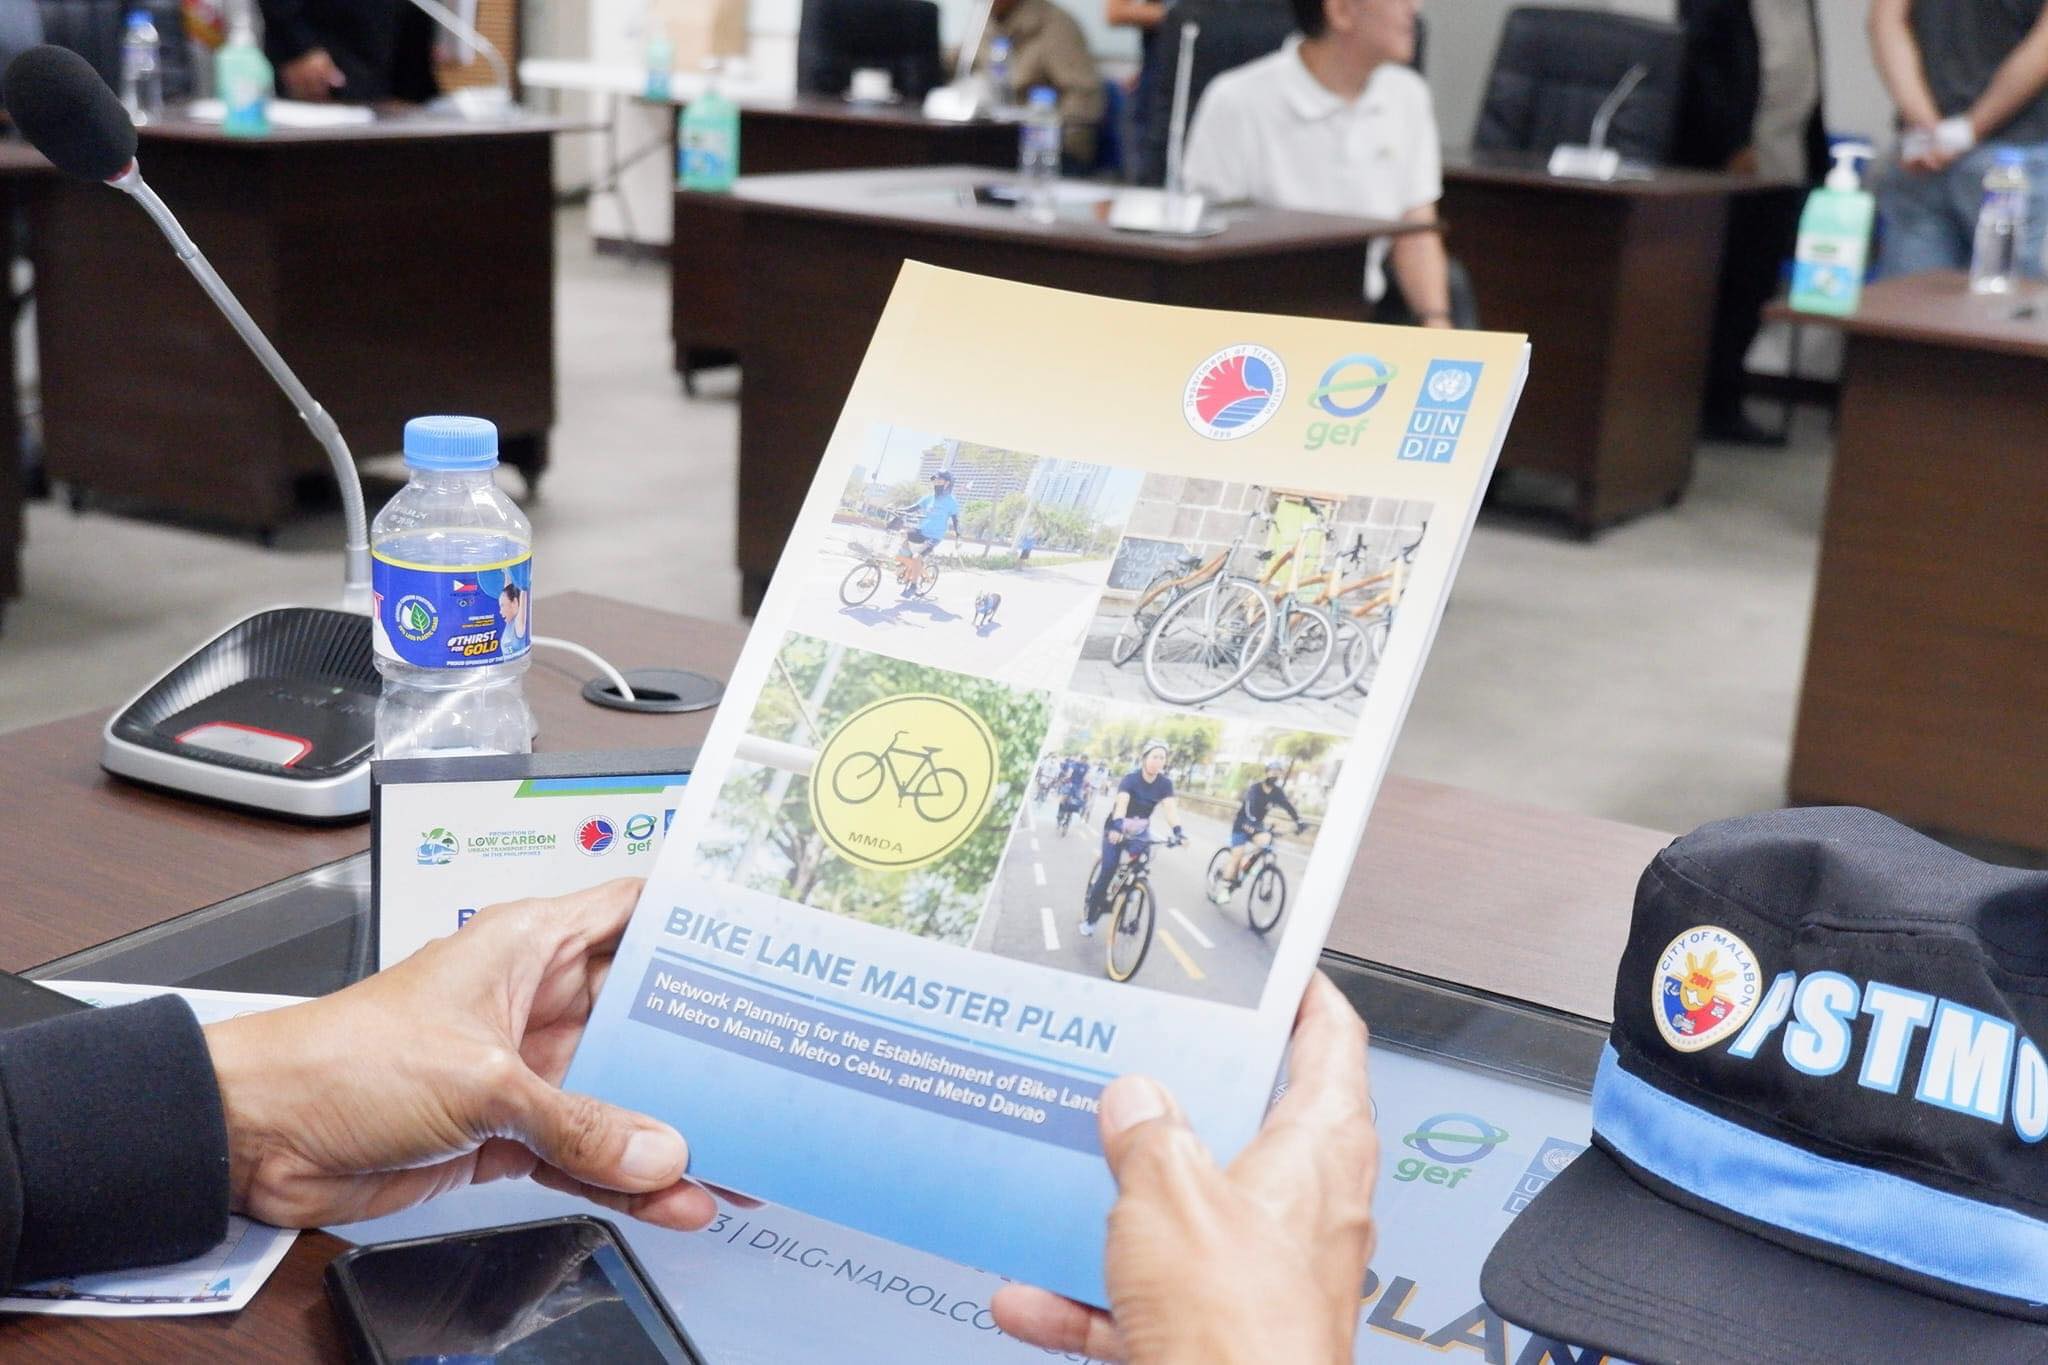 Printed copies of the master plan were distributed to attendees (Photo: DOTr Facebook page)
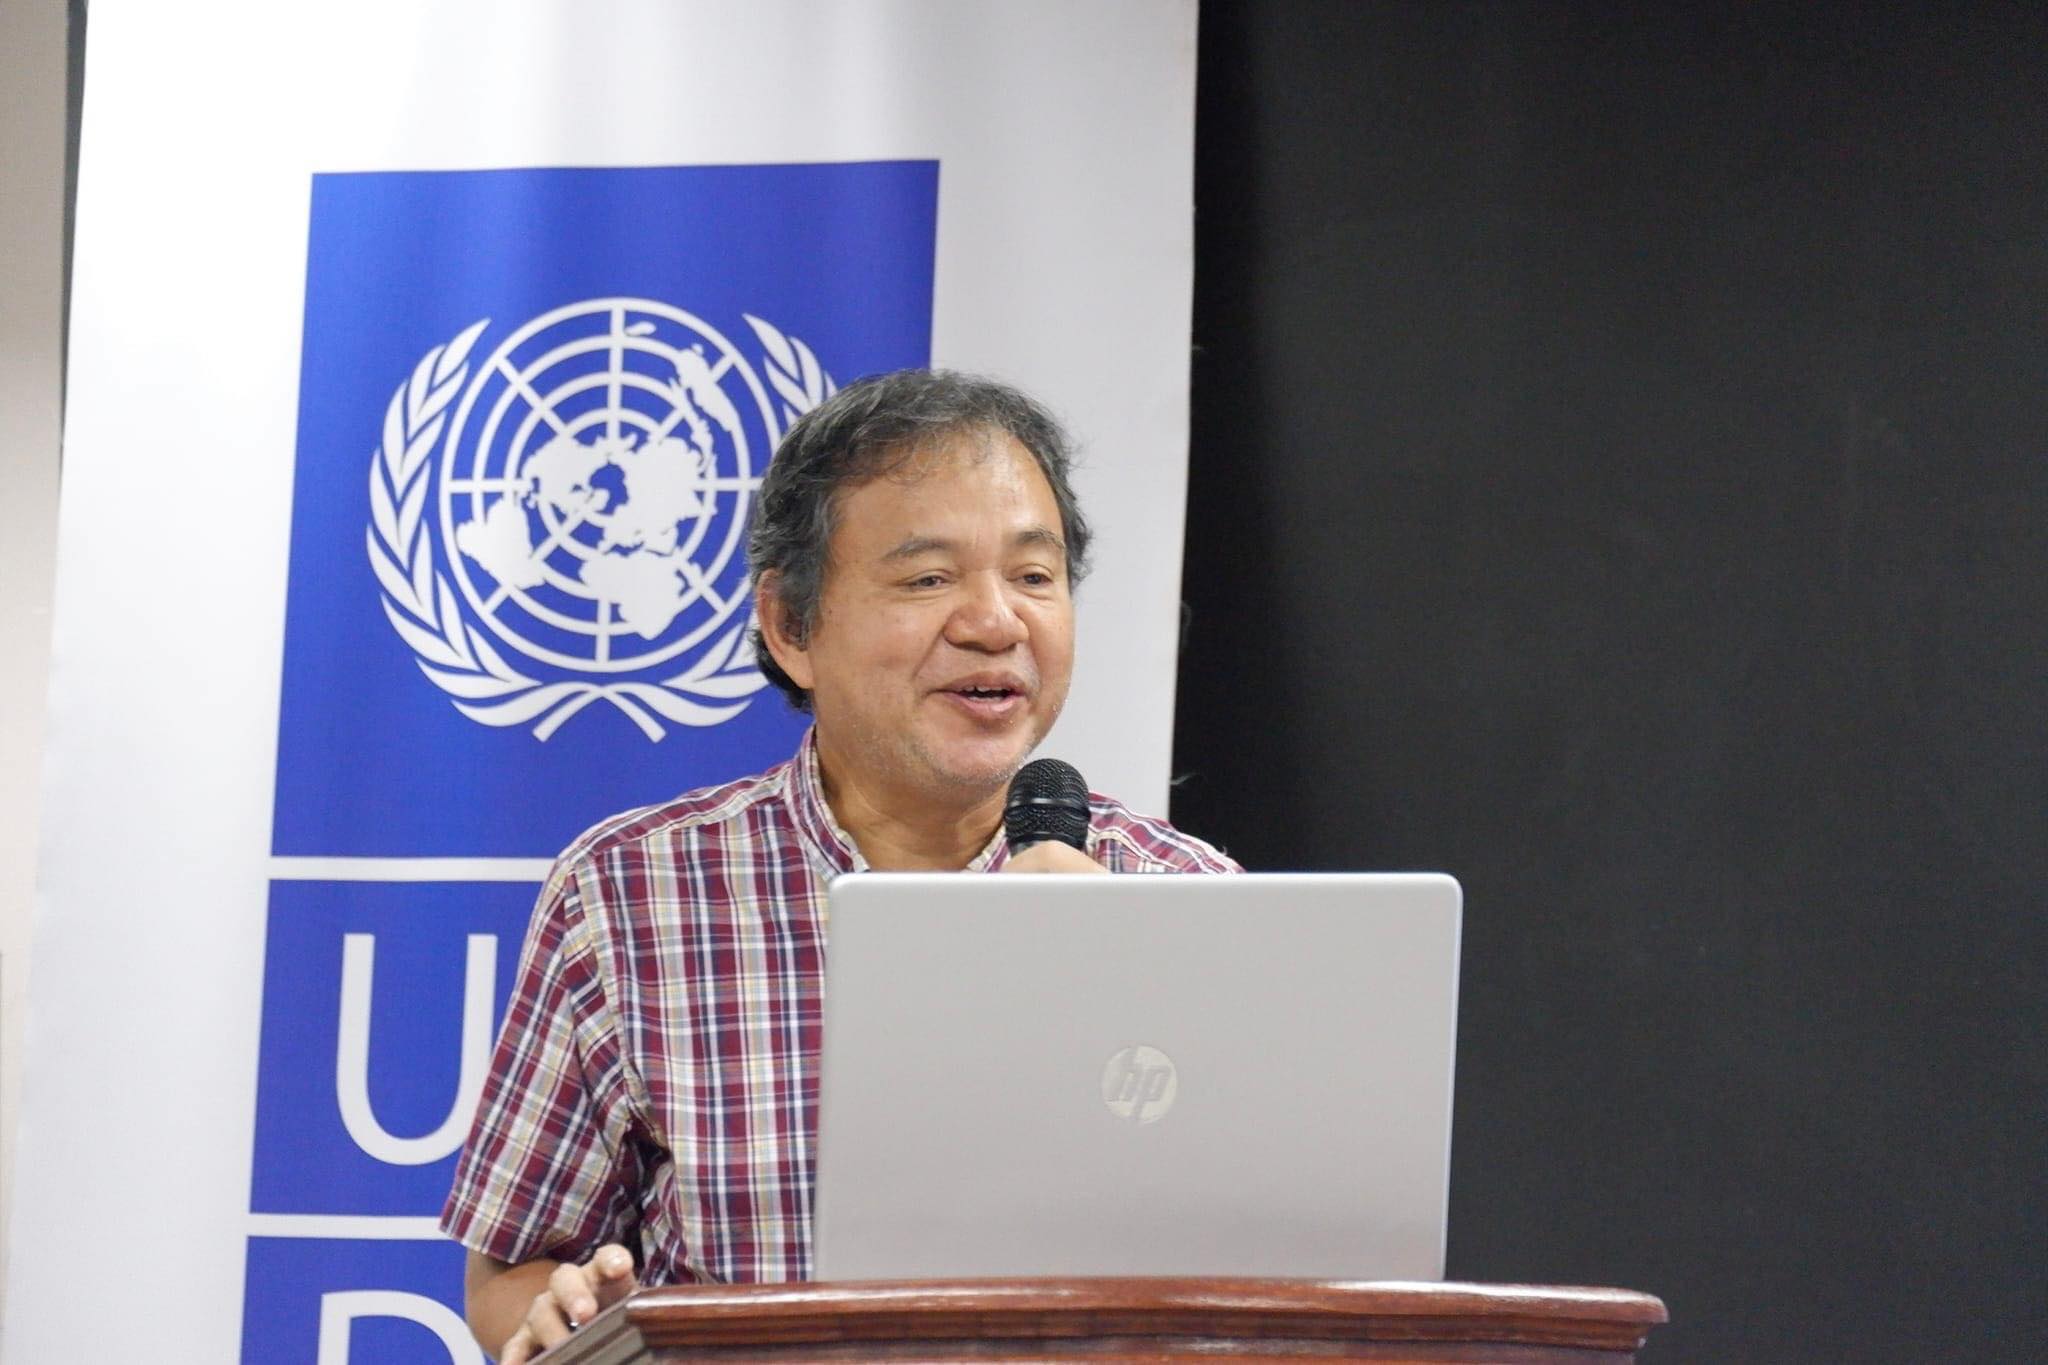 Dr. Ricardo Sigua of the National Center for Transportation Studies presented the highlights or key features of the master plan. The UNDP engaged NCTS to conduct the master planning project for DOTr. (Photo: DOTr Facebook page)
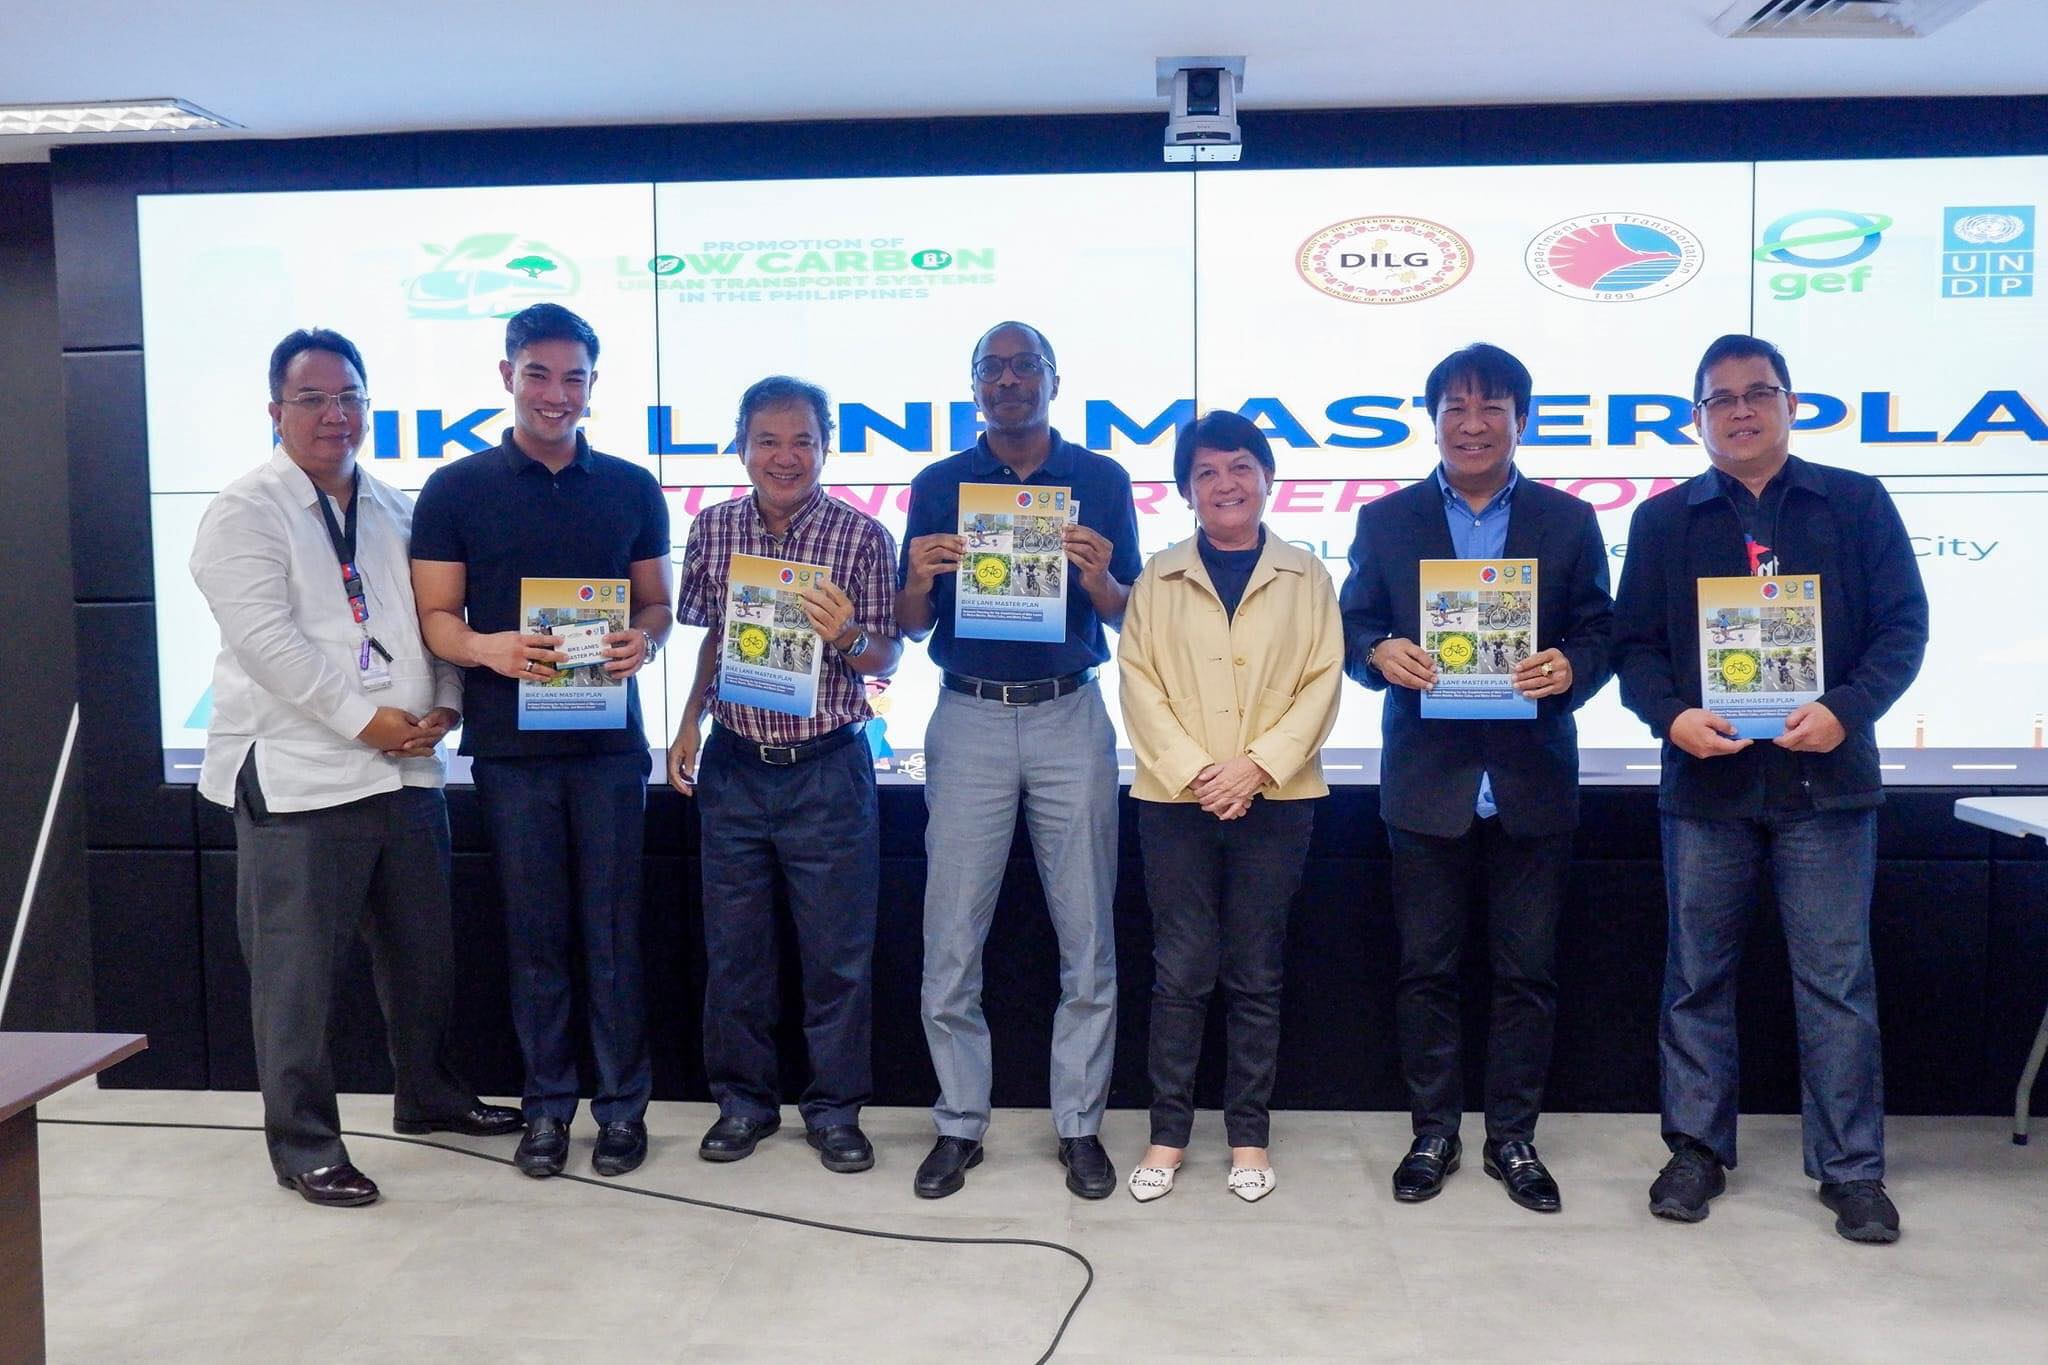 Photo op with participants from the MMDA (Photo: DOTr Facebook page)
While the master plan is most welcome as the country continues to build infrastructure for active transport (mainly walking and cycling), the launch is actually one year late. The project was actually completed last year and though most of the recommendations have yet to be carried out, many items including the inventories are already dated. These master plans though should not be static documents but dynamic in these sense that it would have to be updated regularly. For one, updates would provide the opportunity to reinforce or improve certain aspects of the plan. Updates also provide an opportunity to check whether progress is being made on the targets set in the plan. Also, since the master plan is for three metropolitan areas perhaps it can be part of the foundation for a nationwide plan. However, many plans fail if there is not support or scarce resources allocated for the implementation. Thus, there is a need for resources or allotments especially coming from government to support the realization of the plan.
–
Article share: What’s Incomplete About Complete Streets?
The concept of road diets circulated in Metro Manila more than a decade ago. I recall the Metro Manila Development Authority (MMDA) picked up the concept and attempted to apply it in some parts of Metro Manila. Since there are no evidence of that endeavor surviving now, then we can assume that it was a failure. There is no wonder there as I also recall the effort to be half-hearted and more to get media mileage (cheap talk or lip service) out of it. Road diets eventually evolved into the complete streets (though the literature now will state road diets as part of complete streets). That experience and similar initiatives of varying success (or failure) rates are not unique to the Metro Manila but is actually happening elsewhere including cities in countries where the complete streets have been applied more comprehensively and yet somehow found to be lacking or not as effective a solution as expected. I am sharing an article here that discusses what seems to be lacking or ‘incomplete’ as it is referred to.
Source: What’s Incomplete About Complete Streets?
Quoting from the article:
“What’s missing? First of all, even the best Complete Streets policy can’t solve the problem of fiscal scarcity. Even in a city committed to Complete Streets, street redesign must fight for public dollars with other worthy goals such as education and public safety. As a result, Indianapolis’s improvements are a drop in the bucket. The city maintains 3,400 miles of streets and roads, so its 100 miles of bike lanes affect only 3 percent of the city. Similarly, 2,000 miles of the city’s roads still lack sidewalks.
Second, the quantitative benchmarks seem to focus on sidewalks and bike lanes (Sec. 431-806), and the policy doesn’t mention traffic calming or similar policies. So if the city had a six-lane road with traffic going 60 miles per hour, the Complete Streets policy would not affect that road except to the extent necessary to build a sidewalk or a bike lane.** Thus, even the best Complete Streets policies don’t really address some of the most dangerous features of American street design.”
—
Article on “Fair Share Transportation Planning”
I am sharing this new article from Todd Litman on fair share transportation planning. The content is relevant and very timely in the Philippines considering many people including and especially transport officials are struggling with the thought of allocating resources to provide or improve facilities geared towards more equitable transport systems (e.g., more facilities for active transport).
Here’s the summary as quoted from the article:
“To be efficient and equitable, a transportation system must serve diverse demands. A diverse transportation system allows travelers to use the most efficient option for each trip—safe walking and bicycling for local errands, efficient public transit when traveling on busy travel corridors, and automobiles when they are truly the most cost-effective mode considering all impact—and it ensures that people who cannot, should not, or prefer not to drive receive their fair share of public investments.
Current transportation planning practices are biased in various ways that overinvest in automobile infrastructure and underinvest in more affordable, inclusive, and efficient modes. It is time for planners to reconsider our analysis methods and funding practices to ensure that non-auto modes, and therefore non-drivers, receive their fair share of transportation resources.
This is not anti-car. Motorists have good reasons to support more investments in non-auto modes that reduce their traffic and parking congestion, reduce their chauffeuring burdens and crash risk, and provide better options when their vehicles are unavailable. Everybody wins from a more diverse and efficient transportation system.”

