
Home » Governance (Page 15)
Category Archives: Governance
Article on how cities can rapidly expand bike networks
With the increasing popularity of bicycles for utilitarian use (e.g., bike to work, bike to school, etc.), the need for strategies, programs and projects to support cycling has become more urgent. This is mainly to sustain the increase of bicycle use and partly to enhance the safety of cyclists. Here is an article that discusses how cities can rapidly expand bike networks:
https://www.urban.org/urban-wire/how-can-cities-rapidly-expand-access-cycling-infrastructure
To quote from the article:
“Our research points to several key recommendations for other cities hoping to expand their cycling infrastructure and encourage a more rapid shift toward biking and away from cars.
– Local governments can lead the implementation of a large-scale expansion of cycling infrastructure if local leaders can commit to ambitious, quantified mileage goals that will help structure how capital dollars are spent.
– Local implementation goals should include metrics related to increasing equity, particularly for people of color and those with low incomes. Although the Final Mile program increased the number of miles of cycling infrastructure, it did not directly prioritize the people who could benefit most from improvements.
– Philanthropic funders interested in supporting climate-friendly infrastructure should ensure their funds help hold local policymakers accountable to achieving their commitments instead of funding infrastructure projects directly. They can also encourage collaboration between cities and nonprofit advocates while working to fill local capacity gaps, such as through engineering consultants.”

Article on evaluating transport equity
Here is another quick share of an article on transportation equity:
Litman, T. (February 2, 2022) “Evaluating Transportation Equity: ITE Quickbite,” Planetizen, https://www.planetizen.com/news/2022/02/116058-evaluating-transportation-equity-ite-quickbite [Last accessed: 2/4/2022]
Transportation equity is a very relevant, very timely topic as people in the Philippines are just beginning to understand and weigh the advantages of having more efficient transport in the forms of active and public transport over private vehicles.
–
UPSE Discussion Paper on Martial Law and the Philippine Economy
To those who were looking for references on the Philippine economy during the Martial Law years, look no further than a recent discussion paper from the UP School of Economics (UPSE). To quote from their social media post:
UPSE Discussion Paper No. 2021-07 (November 2021)
📌Title: Martial law and the Philippine economy
🖊Authors: Emmanuel S. de Dios, Maria Socorro Gochoco-Bautista, Jan Carlo Punongbayan
📄Abstract: Part of a proposed anthology, this article provides a concise review of the economic performance during the period of the Marcos dictatorship (1972-1985) from a comparative historical perspective. We examine the external events and internal policy responses that made possible the high growth in the early years of martial law and show that these are integral to explaining the decline and ultimate collapse of the economy in 1984-1985. The macroeconomic, trade, and debt policies pursued by the Marcos regime—particularly its failure to shift the country onto a sustainable growth path—are explained in the context of the regime’s larger political-economic programme of holding on to power and seeking rents.
📖 Read the full paper here: https://econ.upd.edu.ph/dp/index.php/dp/article/view/1543/1027
https://econ.upd.edu.ph/dp/index.php/dp/article/view/1543/1027
Why is this relevant to transportation in the country? Economic performance and policies during that period strongly influenced if not practically dictated infrastructure development during the period. Add politics to the mix and you get what ultimately affected future administrations in terms of debt servicing and other financial or fiscal issues that needed to be addressed due to the debt incurred during that period.
We should learn from this and hopefully not repeat it. Unfortunately, the fiscal discipline and reforms during the previous administration appear to have been abandoned and the current spending and borrowing spree will likely handicap future administrations. Are there bad debts around? Probably! And so there will likely be a need to do some due diligence during the transition to a new administration after the elections this year.
–
On the role of women in transportation
I found this podcast on “Advancing the Role of Women in Transportation” on the AASHTO thread:
This reminded me of the Women in Transport Leadership (WiTL) group that friends formed a few years ago. They are active in promoting the role and relevance of women in transport as well as equity in transportation.
–
On “universal basic mobility”
You’ve probably heard or read about the concept of “universal basic income.” The concept has been discussed and implemented or attempted in some countries including those that have successfully tinkered with their social welfare systems. Here is an article that presents and discusses the idea of universal basic mobility:
Descant, S. (December 22, 2021) “‘Universal Basic Mobility’ Speaks to a City’s Values,” Government Technology, https://www.govtech.com/fs/universal-basic-mobility-speaks-to-a-citys-values [Last accessed: 12/24/2021]
It was in graduate school back in the 1990s when I first encountered the concept of the ‘transportation poor’ and ‘transport poverty’. While the term suggests people who are generally in the low income classes, the actual definition of transport poverty is more complicated and comprehensive than that. While sustainable transport and its current versions have always discussed the more fad issues on public transport, low carbon transport, active transport, etc., specific engagements on the more rad topic of equity in transportation have not been as common. Perhaps this current issue and discussions on the government’s “no vaccination, no ride” policy will open doors for equity to be out in the open?
–
Placeholders and inheritors
[Notice to the reader: This post is not directly about transport or traffic.]
I like one post circulating in social media that is attributed to former Sen. Ramon Magsaysay, Jr. about the Vice President. I particularly like this part: “Did NOT choose to be a placeholder when her husband finished his term as Mayor in Naga.” If you do a scan of elected officials around the country, you can probably see how many if not most are held by political families. Even Marvel Comics recognizes this when they featured Filipino superheroes in an Iron Man series where the original team perished and was replaced by their children!
Placeholders are usually wives of politicians who have reached the maximum of their term limits. A mayor, for example, can only run for reelection twice for a total of 9 years continuously in power. After the nine years, he/she must step down to give way to a new mayor. Instead of honing someone competent from the other leaders in the local government (e.g., the vice mayor, a councilor, etc.). As they say, elective posts in the Philippines are family business and are often passed on to the next generation of what are termed as dynasties.
My most recent encounter with a “placeholder” was with the then Mayor of Tacloban City, Cristina Gonzales-Romualdez. She was on the second year of her term after she took over from her husband who was mayor for 3 terms (9 years). I must say that she had very competent staff and we thought they did their jobs well and for the benefit of many in Tacloban. And this was during the years immediately after the tragedy brought by Typhoon Yolanda (Ketsana).
Previous to that, we’ve also encountered or engaged with other local government units dominated by certain families. One town in Cebu even had the matriarch as mayor, the son as vice mayor and the uncles as councilors! The municipal hall had a portrait of the patriarch as a multiple term mayor in the recent past. You wonder if there were no other competent people in such towns and cities.
The next presidential elections will feature the son of a former dictator with the daughter of a current president as running mate. They are supported by other dynasties such those of two previous presidents including one who was been convicted of plunder but pardoned by his successor. He was allowed to run for president again despite the conviction as the Comelec failed to make a firm interpretation and stand vs. it. Now comes someone who believes he is entitled to the presidency despite also being convicted of tax evasion. While arguably a lighter crime, it is still a conviction and should mean he cannot run for the highest position in government. He’s also a fraud because he claims to have completed his education at a well known UK school when in truth he failed there. Would you trust a tax evader, fraud and one who does not admit guilt nor expresses regret or remorse for his family’s crimes with the presidency of the country? I certainly won’t and don’t!
–
What they are not saying about UTSMMA and Metro Manila’s first subway line
My social media feed is suddenly filled with shares of articles (the same PR text apparently) from the Department of Transportation, its Secretary and his fans and local rail aficionados about the progress of the Metro Manila Subway Project, which is dubbed as Metro Manila’s first subway line. While these posts start and appear as factual narratives, they are silent about certain facts that the writers conveniently did not include as part of their narrative. Perhaps it is because they are currently allied with the son of the dictator who decided vs. building what could have been the country’s first subway line and a game-changer for commuting in the metropolis.
UTSMMA or the Urban Transport Study in Manila Metropolitan Area was completed in 1973 and was immediately followed by a Feasibility Study on the Manila Rapid Transit Rail Line No. 1 that was completed in 1976. Here’s a nice render of a subway station platform from that FS:

Two things that need to be said:
- Marcos decided against the subway line in favor of LRT Line 1 after being heavily influenced by a World Bank report and the succeeding MMETROPLAN (funded by the WB). It is also said that he wanted to have the bragging rights to the first mass transit line in Southeast Asia but Singapore’s first MRT line would finish ahead of Metro Manila’s if the Philippines pursued the subway. The latter was a late and fateful decision because commitment to the RTR Line 1 could have been made earlier and construction could have started ahead of Singapore’s (and likely finished ahead if there were no major delays).
- The corruption during the Marcos dictatorship led to succeeding administrations including the current being saddled by debt and unable to put up major transportation infrastructure such as a subway line for decades (this is already well documented so denial or refusal to understand is the burden of the denier – no logic or fact can can probably change such people’s views or beliefs) without piling up more debt.
That said, I would caution vs. delaying the subway project any further. It is already almost 40 years since a subway was due and though the alignment is totally different from what was planned in the 1970s, there’s potential here to revolutionize how people will commute in Metro Manila. It will only become more expensive to build in the future.
–
Article on people-oriented traffic management
Here’s a quick share on a topic that is also very relevant especially for local government units – traffic management. To quote from the article:
“Today, when the mobility of Filipinos is severely constrained by limited public transport capacity, …and when there is heightened pressure for private vehicle use, there is no better time to re-orient traffic management in the Philippines in order to prioritize inclusive, efficient and environmentally sustainable travel modes. The crucial ingredient is not infrastructure but political will.”
Siy, R.Y. (January 8, 2022) “People oriented traffic management,” Mobility Matters, The Manila Times, https://www.manilatimes.net/2022/01/08/business/top-business/people-oriented-traffic-management/1828593 [Last accessed: 1/8/2022]
The article makes perfect sense as traffic management in the country has always been car-oriented including the strategies, policies, schemes, measures and others that have focused on facilitating private car travel over active and public transport modes. The challenge here is how to bring this up front and an election issue at both national and local levels.
–
On transport equity
To start the year 2022, I’m sharing another article by Todd Litman. I thought this was a timely one as this is basically about transport equity and the results despite competent planners and perhaps good intentions.
Litman, T. (December 21, 2022) “Good Planners: Bad Outcomes. How Structural Biases Can Lead to Unfair and Inefficient Results,” Planetizen, https://www.planetizen.com/blogs/115621-good-planners-bad-outcomes-how-structural-biases-can-lead-unfair-and-inefficient?utm_source=newswire&utm_medium=email&utm_campaign=news-12232021&mc_cid=35d4ce69aa&mc_eid=9ccfe464b1 [Last accessed: 12/27/2021]
There should be similar studies for the Philippine case. We need to understand and correct bad practices including those related to an over-reliance to what is referred to as “old school” practices (i.e., “nakasanayan na”, “ginagawa na noon pa”, and so on), which is what young engineers and planners are taught by the “old boys” in certain agencies as an initiation of sorts if not part of their ‘continuous orientation’ at these offices.
–
Back to the old normal?
As traffic continues to worsen after, The MMDA has reinstated the number coding scheme albeit from 5:00 to 8:00 PM on weekdays for now. This is in recognition of the worsening traffic congestion brought about by people returning to their workplaces and the easing of travel restrictions across the entire population. People are now moving about as can be seen in transport terminals and commercial areas (e.g., shopping malls, markets, etc.). With the return of severe traffic congestion, it begs the question whether we are back to the ‘old normal’.
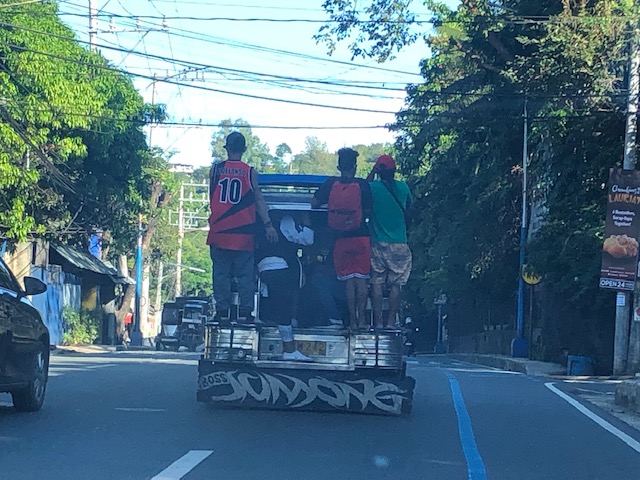
I thought the photo above pretty much describes how it was before Covid-19. The problem is that this photo was taken earlier today and we are still technically in a pandemic. Does the photo show the people’s renewed confidence in using public transportation? Or is it a matter of necessity (i.e., commuters having no choice but to risk it in order to get to their workplaces or home)? If they had motorcycles, these people would likely use them instead of taking the jeepney. I will also dare ask why don’t they bike instead? They seem able bodied enough to try cycling instead. Is it because their commuting distances are long? Or are there other reasons that evade us? If these are the same reasons and Covid-19 is not a major factor for their choice, then perhaps we are back to the ‘old normal’ and have not progressed significantly despite claims by various groups that we are experiencing a paradigm shift in favor of active transport. All the more that we need to urgently revisit and reassess how transport should be in order for us to transition to a more sustainable future.
–
