
Home » Governance (Page 6)
Category Archives: Governance
Sharing the road with persons with disabilities
The wife took this photo as we were turning at the roundabout at Tikling Junction in Taytay, Rizal. I just wanted to share this here for everyone’s awareness that there are those of us traveling who have certain disabilities that may not be so obvious. We probably see people on wheelchairs or special vehicles like those you’d find along Cainta roads especially near or in the vicinity of Tahanang Walang Hagdanan. And then there are those with PWD stickers on their motor vehicles. But are we aware and sensitive to the needs of others like this deaf cyclist? There should be policies to ensure their safety as they should be able to travel for whatever purpose they may have similar to our senior citizens and children who are among the most vulnerable road users. And drivers and riders should have the training and the empathy to share the road with them.
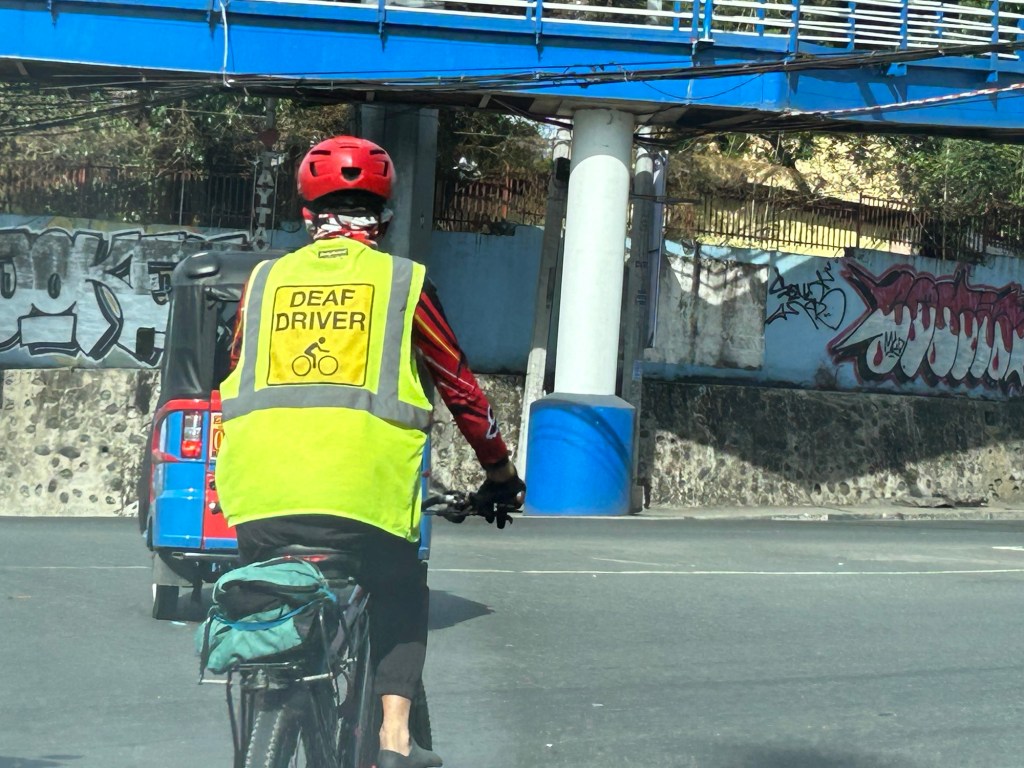 Deaf rider along Tikling Junction, Taytay, Rizal – not all would probably have a vest like this and motorists likely would be oblivious to their situation. There will also be pedestrians with similar circumstances who have natural disabilities. Irresponsible would those who are “deafened” by their gadgets like those wearing earphones or headphones while riding or walking.
 –
Is the MMDA’s coding scheme still effective?
That’s actually a title of a paper or article I co-wrote before. At the time, which was over a decade ago, we were revisiting certain travel demand management (TDM) measures being implemented in Metro Manila. We already concluded that the effectiveness of the number coding scheme has been reduced mainly as people bought a second, third or more vehicles to be able to use any vehicle on coding days.
Since then, coding’s effectiveness continued to be eroded by a combination of increasing vehicle ownership (including more vehicles operating as ride hails) and the rapid increase of motorcycles.
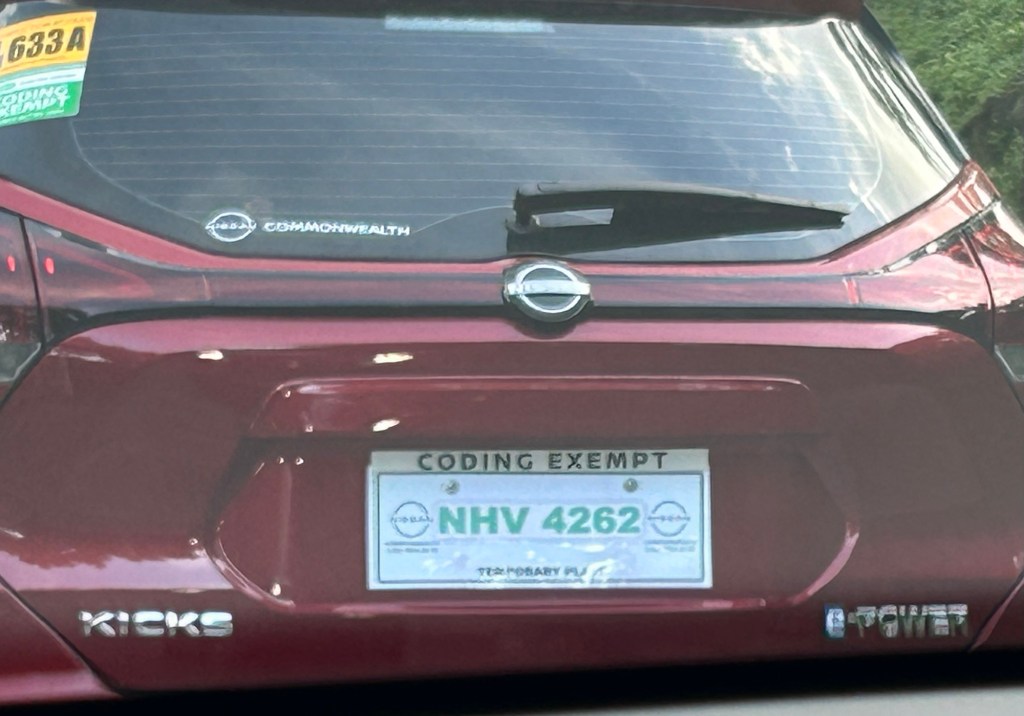
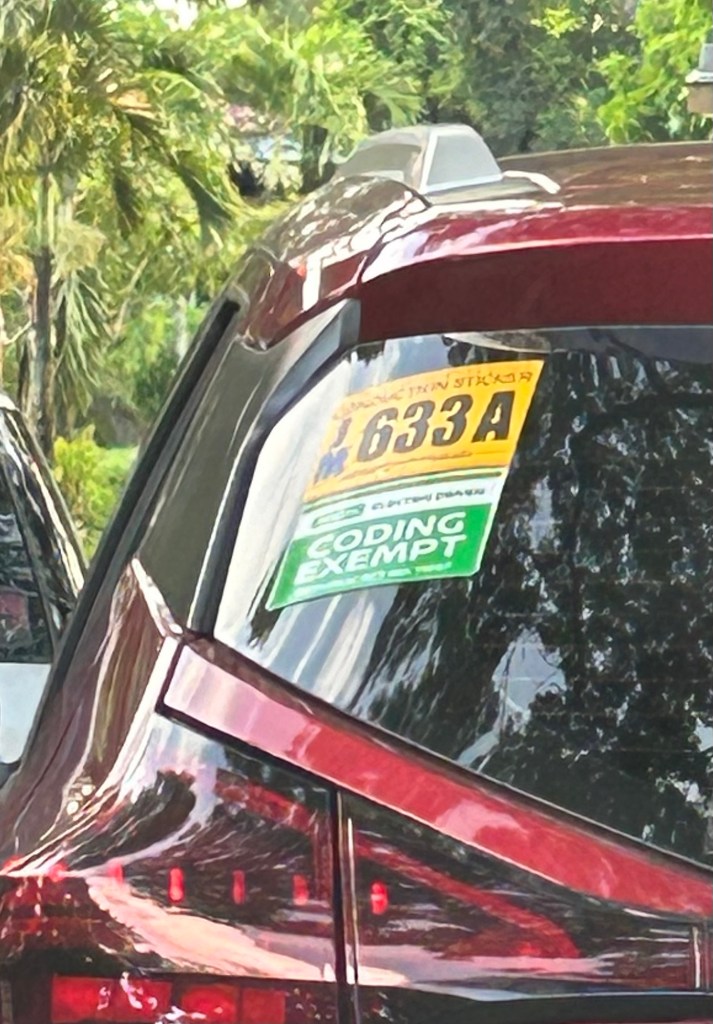
More recently, government decided to give push for electric and hybrid vehicles. The MMDA made these coding exempt, which perhaps is an example of instituting a policy with unintended consequences. I say unintended here because the agency seems oblivious to the fact that people will likely get that second, third or more vehicle. And that will be an EV or hybrid. Manufacturers are already marketing these as ‘coding exempt’ and they are making a good sales pitch here.
Maybe it’s time to revisit coding and re formulate it? But then coding wasn’t supposed to be sustained as long as it has. Government should be more aggressive and decisive for public transport in order to retain and increase mode shares that have also been reduced by more private vehicle and motorcycle use.
–
On transportation and global health – article share
I was supposed to write about the keynote lecture delivered during the 30th Annual Conference of the Transportation Science Society of the Philippines (TSSP). I am sharing instead an article written by Dr. Renzo Guinto who is an Associate Professor at the SingHealth Duke-NUS Global Health Institute based at the National University of Singapore.
Here is the link to his article on the Philippine Daily Inquirer: Health at the center of transport and mobility
I will not quote from the article and leave it to my readers to read and appreciate the articles content.
–
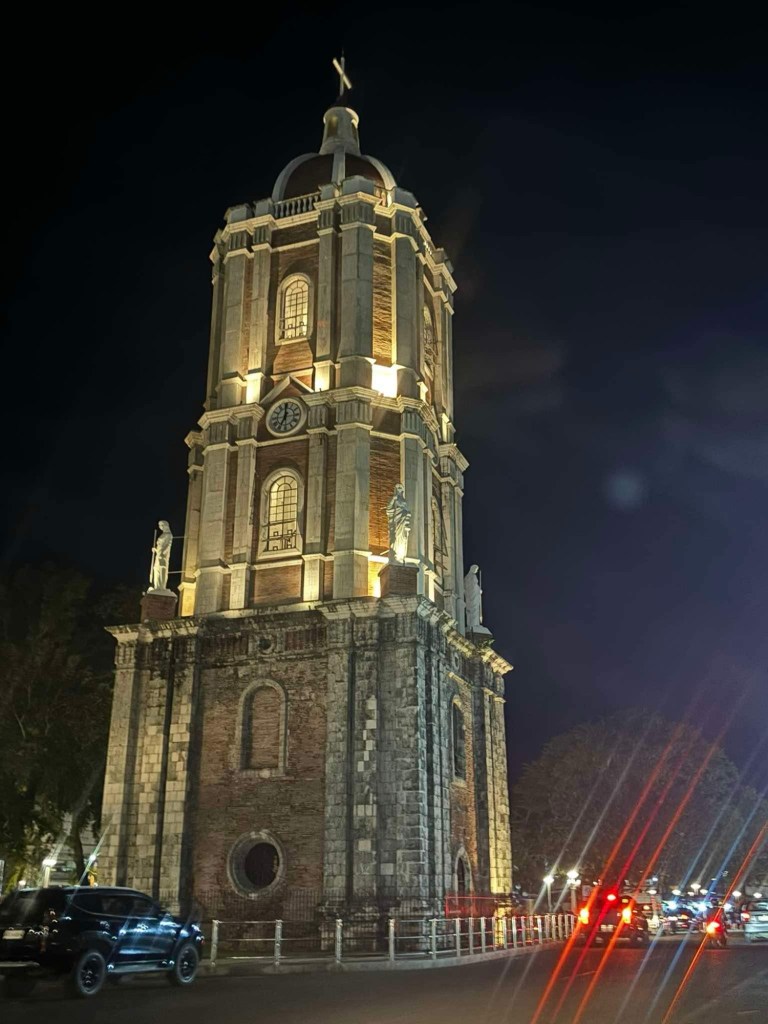
Back in Iloilo (again) and a note on landmarks
One landmark that I have been familiar with since I was a child is the Jaro Cathedral belfry. The building is located at the plaza across from the church. The area has been neglected for a long time and I am glad to see the city developing the area to become more attractive and useful as a park for the benefit of its citizens and visitors.
The area, I’ve been told, is being developed as part of a program towards coming up with more open spaces like parks particularly where there are already plazas around the city. I have memories of getting a ride back to my father’s hometown whenever we went to the city usually to eat or shop. The informal jeepney terminals used be around the plaza. Other jeepneys rounded the streets for their return trips instead of stopping at a terminal. Now you have to travel to the provincial jeepney terminals at the outskirts of the city to get a ride to the other towns.
–
On ride hailing replacing more sustainable options for transport
We’ve long suspected that ride hailing or ride sharing is not as sustainable as their proponents and companies would project them to be. Here is more evidence showing how ride hailing has diminished other more sustainable transport options.
Kerlin, K. (August 28, 2024) “Half of Uber, Lyft Trips Replace More Sustainable Options,” UC Davis News, https://www.ucdavis.edu/news/half-uber-lyft-trips-replace-more-sustainable-options [Last accessed: 9/8/2024]
Quoting from the article:
“About 47% of the trips replaced a public transit, carpool, walking or cycling trip. An additional 5.8% of trips represented “induced travel,” meaning the person would not have made the trip were an Uber or Lyft unavailable. This suggests ride-hailing often tends to replace most sustainable transportation modes and leads to additional vehicle miles traveled. “
The article and the study by UC Davis is limited to their experiences with Uber and Lyft and perhaps others that employ cars. In our case, we have in addition motorcycle taxis or habal-habal that further takes away passengers from public and active transportation. Motorcycle taxis provide a very attractive alternative to conventional public transport modes as these are perceived to reduce travel times among other advantages they provide to users.
I will share some information later about the current mode shares in Metro Manila and how drastically public transport mode shares have been eroded post pandemic.
–
Technical sessions at the TSSP 2024 Conference
I am sharing here the latest draft of the technical sessions for the 30th Annual Conference of the Transportation Science Society of the Philippines (TSSP). The conference will be held in Iloilo City this coming September 13, 2024.
I will share the draft program for the morning plenary session in the next post.
–
On trees as solution to many of our urban problems
I am sharing this nice article on trees being the solution to many of our urban problems. I think many people have come to notice the importance of trees and the role they play with the increasing temperatures (i.e., heat) we’ve experienced the past years. The science on this state much more and covers not just temperatures but flooding, energy and infrastructure as well. Discussions and examples on these are in the article:
Durand-Wood, E. (August 8, 2024) “The Multi-Tasking Marvel: How Street Trees Can Solve Many Municipal Problems,” Strong Towns, https://www.strongtowns.org/journal/2024/8/8/the-multitasking-marvel-how-street-trees-can-solve-many-municipal-problems [Last accessed: 8/28/2024]
To quote from the article:
“Planting and maintaining street trees is an investment, but it’s one that pays for itself over and over again. Cities around the world are starting to calculate the economic value of their urban forests, a task made feasible with tools like i-Tree.
And more research is finding that trees pay for themselves many times over. A U.S. Forest Service study “conducted in five U.S. cities found that every dollar invested in the management of urban trees [ …] yields annual benefits of $1.37 to $3.09.
Trees are also the perfect example of a small bet. They cost relatively little, but the many varied returns are so high.”
–
Pedestrian-Friendly Cities: The Impact of Walkability Grants
Here is a quick share of an article on how to encourage cities to be more pedestrian-friendly:
Source: Pedestrian-Friendly Cities: The Impact of Walkability Grants
Many of our cities, particularly the highly urbanized ones, are not as walkable as we want them to be. Lacking are the most basic facilities such as sidewalks and safe crossings. Walkability Grants such as those in the US can encourage cities to build and/or enhance pedestrian infrastructure. Many designs such as those footbridges along EDSA and Commonwealth Avenue, for example, are anti-walking. Grants may be used to come up with better designs for walkways and footbridges.
To quote from the article:
“Walkability grants are awards for programs and projects creating innovative pedestrian infrastructure, such as new sidewalks, crosswalks, plazas, street lights and green spaces. For example, in February 2023, the Biden-Harris Administration announced the Safe Streets and Roads for All Grant Program, delivering $800 million in monetary awards for 511 projects addressing public safety and road improvements…
Reshaping the built environment into a walkable haven helps boost the local economy and sustainability. By changing the urban landscape, citizens are more inclined to walk instead of drive, allowing cities to reduce emissions, improve air quality and create healthier neighborhoods. This is critical, considering air pollution is responsible for 7 million early deaths yearly.”
Perhaps we can have similar grants coming from national government via the Department of Interior and Local Government (DILG) in cooperation with the Department of Transportation (DOTr) and the Department of Public Works and Highways (DPWH)? There was some funding for bikeways during the pandemic but this new one should put more emphasis on walkability.
–
Article share: on how transportation impacts your health
I’ve written or shared articles here about transportation and health. I share another article concerning how transportation impacts our health. Here’s our first article share this August:
Harris, A. (August 1, 2024) “Getting there is half the battle: how transportation impacts your health,” The Flint Courier News, https://theflintcouriernews.com/getting-there-is-half-the-battle-how-transportation-impacts-your-health/ [Last accessed: 8/14/2024]
To quote from the article:
“In health, transportation is essential to how people access health care and maintain health,
whether it is getting to the doctor, picking up medication from the pharmacy, going to the
grocery store to maintain nutritional needs, or walking around their neighborhood to get more
exercise.”
–
On a city’s part in making bike and scooter shares succeed
I recently posted about Bonifacio Global City (BGC) and the bike and scooter share they have there. There was one bike share there and in the Ortigas Center before the pandemic. But those fizzled out for various reasons including not so many people using it. Here’s a report on bike and scooter shares in the US and the observation that cities are not making it easy for these to succeed:
Tu, M. (July 29, 2024) “Report: People Want to Ride Shared Bikes and Scooters, But Cities aren’t Making it Easy,” Next City [Last accessed: 8/2/2024]
To quote from the article:
“Even long standing bike share systems can fall victim to the whims of leaders who are not committed to investing in greener modes of transportation. Houston recently lost its bike share system, ending 12 years of operations for BCycle after a new mayor hostile to bike and pedestrian improvements overhauled the METRO Houston board.
If cities want to encourage people to ride a bike or scooter instead of getting into a car, they will have to figure out how to fund it — or in other words, put their money where their carbon reduction goals are.”
Though we’re still a long way to achieving the bike and scooter shares they have in other countries such as the US, we should be wary about their experiences. The lessons learned here should already be in mind to those who will be setting up bike and/or scooter shares in Philippine cities. There is a demand for these facilities as people find cycling convenient and safer in some cities. However, LGUs need to invest more and commit to safer and more connected bicycle facilities in order to convince more people to use this active transport mode instead of motorized transport including motorcycle taxis.
–
