
Home » Health (Page 4)
Category Archives: Health
Article share: on how transportation impacts your health
I’ve written or shared articles here about transportation and health. I share another article concerning how transportation impacts our health. Here’s our first article share this August:
Harris, A. (August 1, 2024) “Getting there is half the battle: how transportation impacts your health,” The Flint Courier News, https://theflintcouriernews.com/getting-there-is-half-the-battle-how-transportation-impacts-your-health/ [Last accessed: 8/14/2024]
To quote from the article:
“In health, transportation is essential to how people access health care and maintain health,
whether it is getting to the doctor, picking up medication from the pharmacy, going to the
grocery store to maintain nutritional needs, or walking around their neighborhood to get more
exercise.”
–
On a city’s part in making bike and scooter shares succeed
I recently posted about Bonifacio Global City (BGC) and the bike and scooter share they have there. There was one bike share there and in the Ortigas Center before the pandemic. But those fizzled out for various reasons including not so many people using it. Here’s a report on bike and scooter shares in the US and the observation that cities are not making it easy for these to succeed:
Tu, M. (July 29, 2024) “Report: People Want to Ride Shared Bikes and Scooters, But Cities aren’t Making it Easy,” Next City [Last accessed: 8/2/2024]
To quote from the article:
“Even long standing bike share systems can fall victim to the whims of leaders who are not committed to investing in greener modes of transportation. Houston recently lost its bike share system, ending 12 years of operations for BCycle after a new mayor hostile to bike and pedestrian improvements overhauled the METRO Houston board.
If cities want to encourage people to ride a bike or scooter instead of getting into a car, they will have to figure out how to fund it — or in other words, put their money where their carbon reduction goals are.”
Though we’re still a long way to achieving the bike and scooter shares they have in other countries such as the US, we should be wary about their experiences. The lessons learned here should already be in mind to those who will be setting up bike and/or scooter shares in Philippine cities. There is a demand for these facilities as people find cycling convenient and safer in some cities. However, LGUs need to invest more and commit to safer and more connected bicycle facilities in order to convince more people to use this active transport mode instead of motorized transport including motorcycle taxis.
–
On transportation and floods
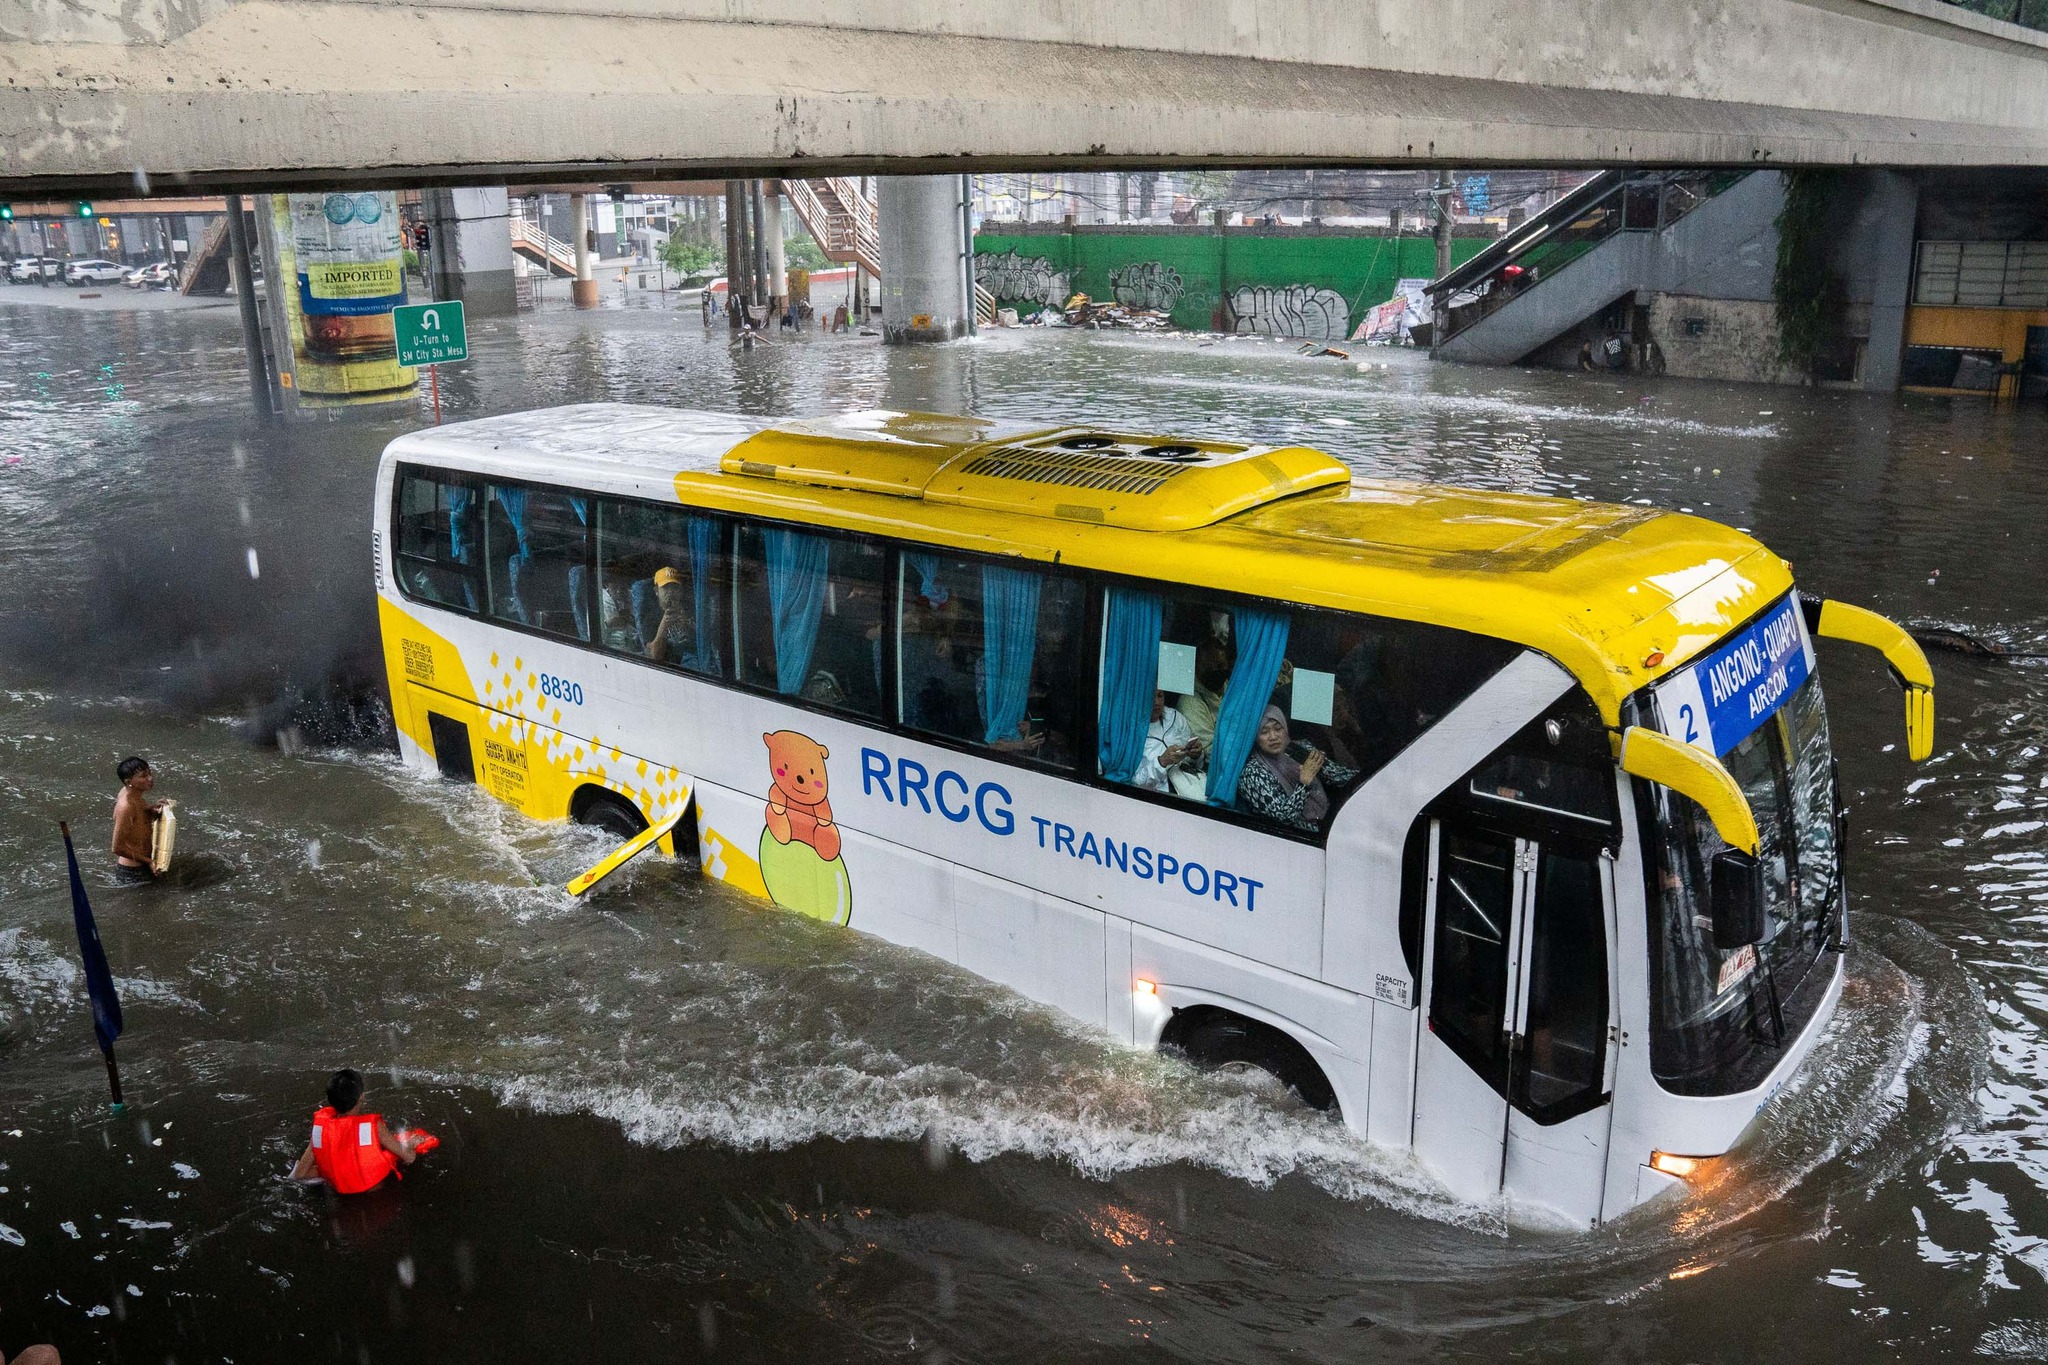
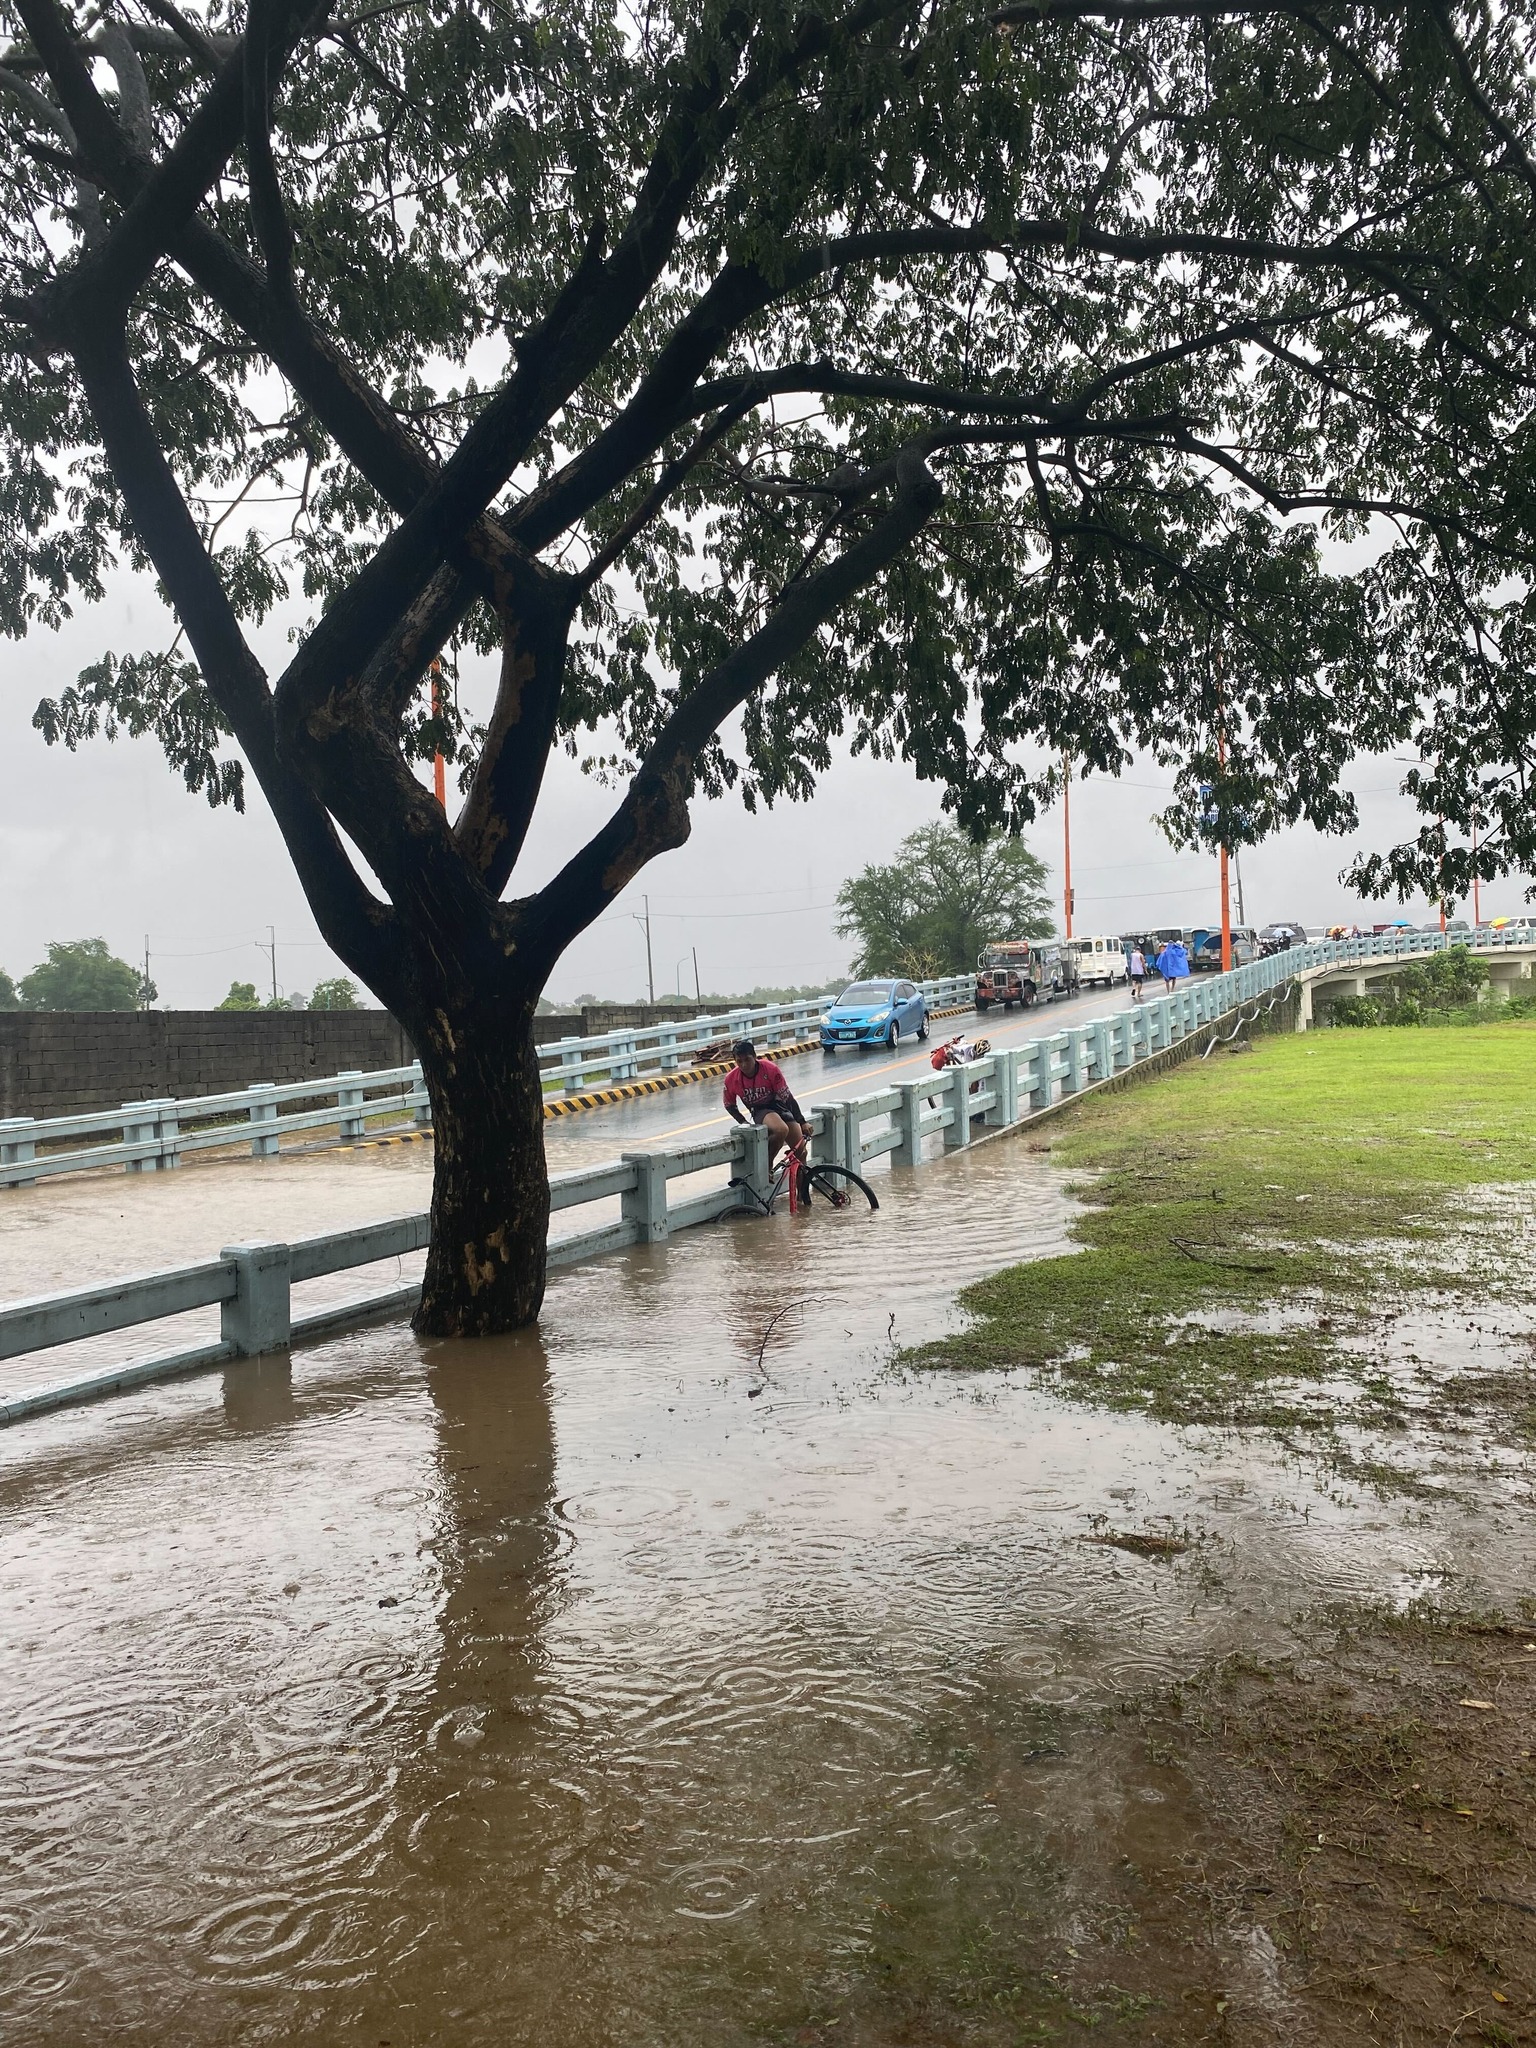
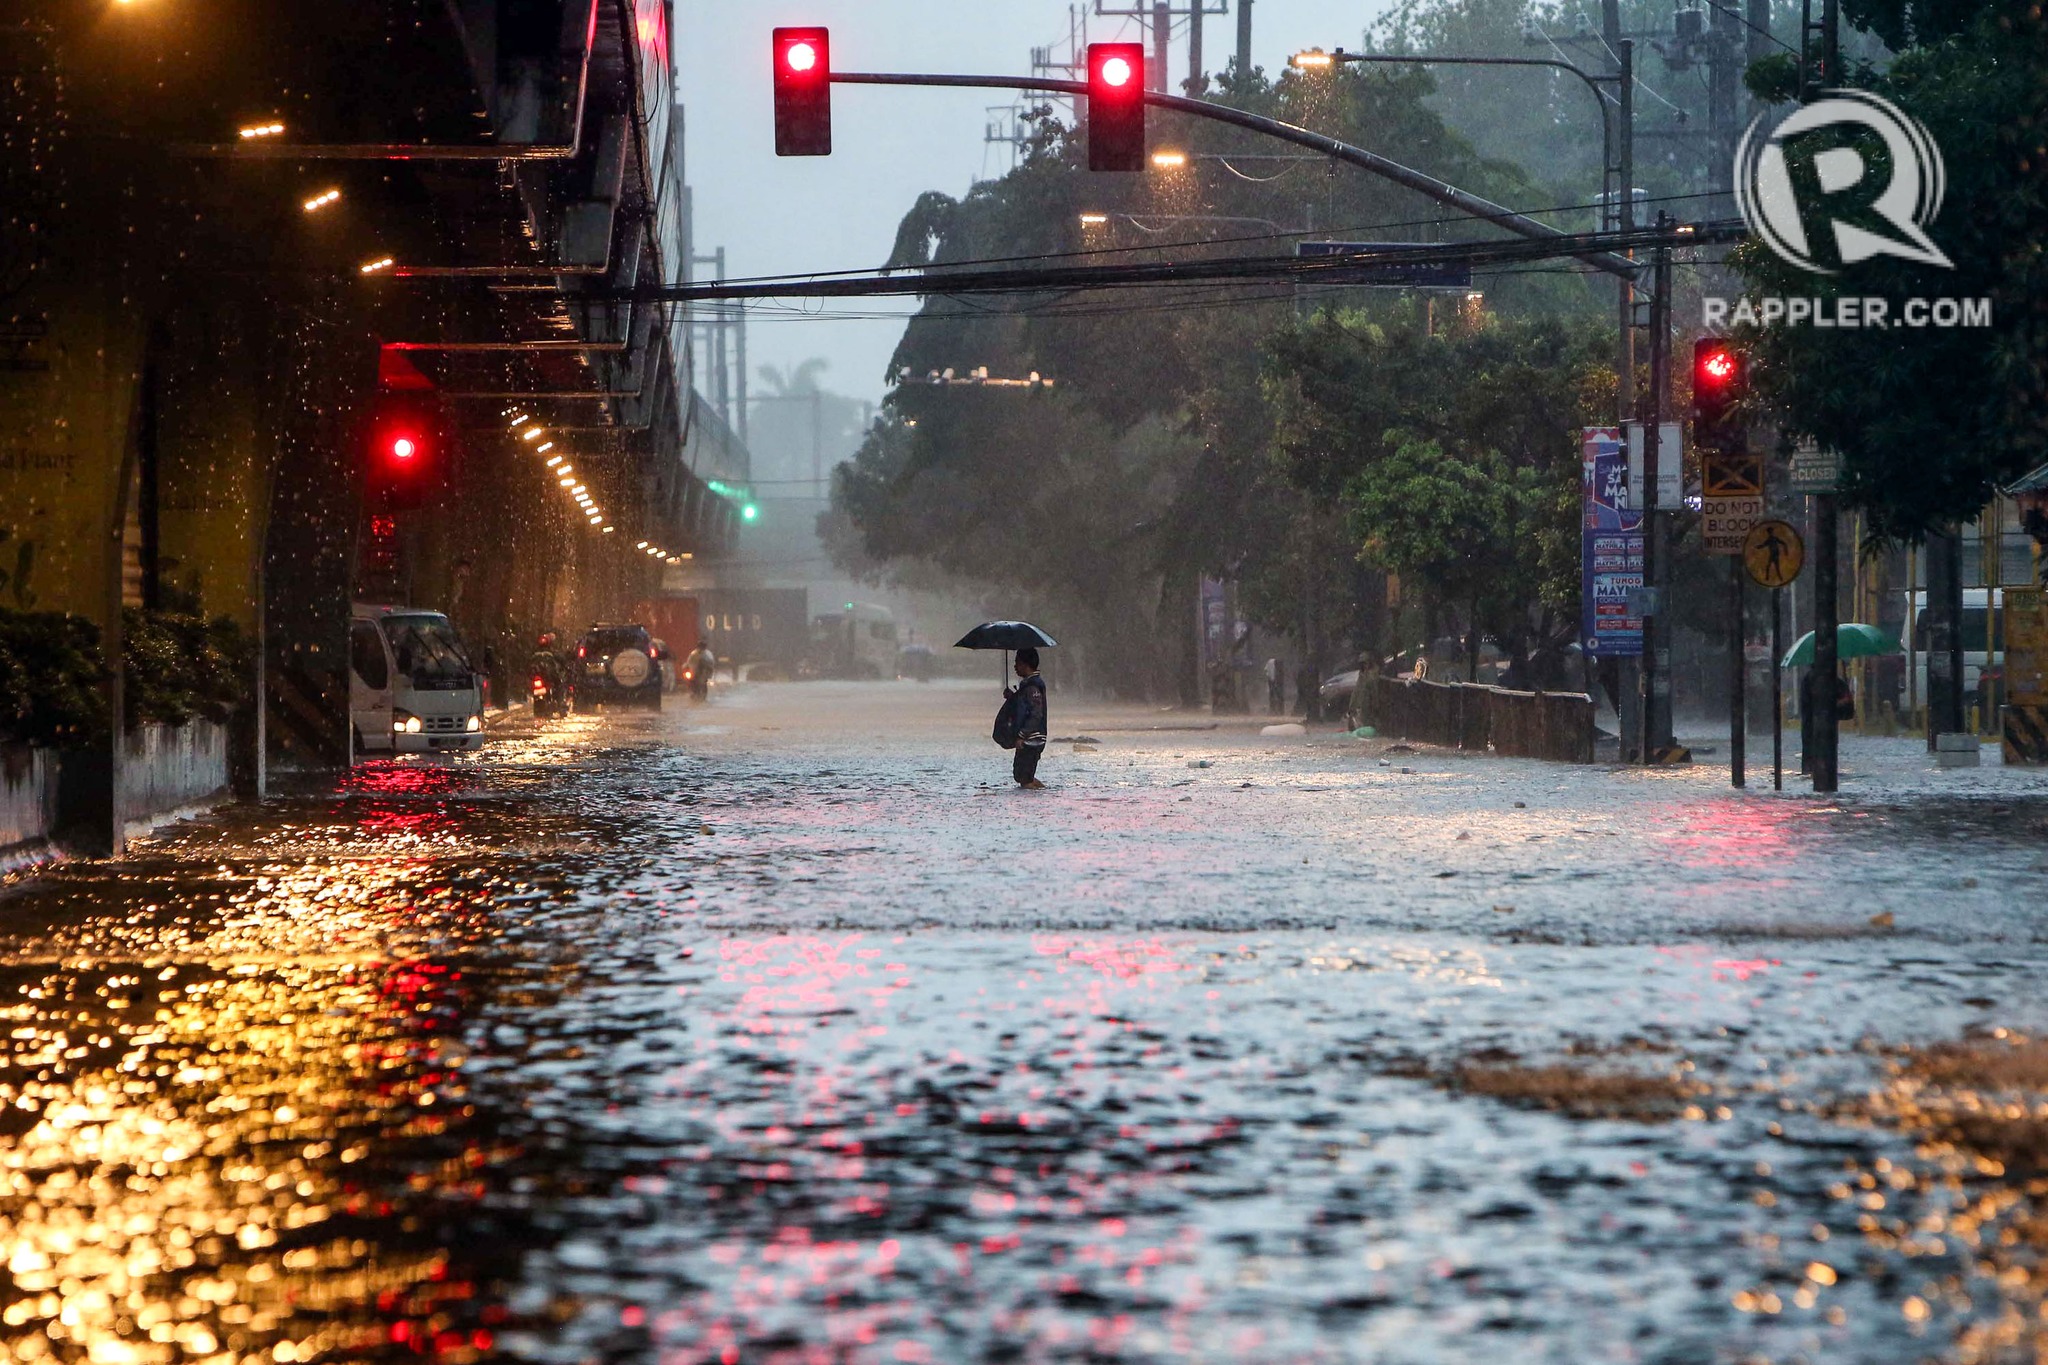
Some people say transport and traffic concerns take a backseat to floods and related concerns, which affect other aspects of our lives aside from our commutes. The heavy rains the past days have rendered many streets impassable to most types of vehicles. That means people cannot go to work, school or come home. Lives are disrupted by floods this way. But even more disruptive and disastrous are the damages brought about by flooding in many communities. Homes are submerged. Properties are damaged, many beyond repair or replacement. There is also the psychological aspect of floods especially for those who will experience them for the first time. These will surely add to the already fragile mental health of people still reeling from the effects of the COVID-19 pandemic.
As I write, the Marikina River has breached and many areas of Metro Manila and surrounding provinces of Bulacan, Rizal, Laguna and Cavite are flooded. The floods are now being mentioned along with those brought about by Ondoy (Ketsana) in 2009.
Here are some photos from the internet being shared by various social media accounts including the official pages of Rappler and Inquirer:
–
On a ‘tipping point’ for bikeability in cities
Here’s a nice article on bikeability and pertains to cities in the United States that developed bikeways or bike lanes during the pandemic. Like many cities that have ‘discovered’ cycling as a viable mode of transport particularly for commuting during the COVID-19 pandemic, it is postulated that there would be a threshold when people would switch to cycling and/or demand for more cycling facilities.
Wilson, K. (June 25, 2024) “Has Your City Passed the ‘Bikeability Tipping Point’?,” StreetsBlog USA, https://usa.streetsblog.org/2024/06/25/has-your-city-passed-the-bikeability-tipping-point [Last accessed: 7/2/2024]
To quote from the article:
“A whopping 183 American communities achieved a score of 50 or higher on PeopleForBikes annual City Ratings this year, up from just 33 in 2019. The means 183 communities have scored at least half of the available points on the group’s signature “SPRINT” rubric that includes such measures as protected bike lanes, safe intersection treatments, and reduced speed limits that are unlikely to kill a cyclist in the event of a crash, among other factors.
And when a city clears that 50-point threshold, the authors of the ratings say that its local bike culture has firmly taken root — and that every new roadway improvement will inspire more improvements, rather than a fierce fight against a car-dominated status quo.
“Once you’ve hit 50, your city probably has a pretty good low-stress bike network,” said Martina Haggerty, the senior director of local innovation at PeopleForBikes. “[That’s] not to say that there aren’t still improvements to be made [but it] probably means that more people are riding bikes in those communities because they feel safe and comfortable. And when more people start riding bikes, those people tend to become advocates for better bike infrastructure and for pro-bike policies, which, [in turn,] will get more people riding.”
There are many links found in the article itself that are “click worthy”. I recommend the reader to explore the rubric from PeopleForBikes and see for yourself how this can be adopted for your city. Is such a rubric applicable to the Philippines? Perhaps, but there would be a need to assess the the situation in each city or municipality. So far, there have been mixed reviews among cities, especially those that appeared to have been more progressive and were more aggressive than others in putting up bicycle facilities including bike lanes. Perhaps the rubric can be applied to see how our LGUs measure up?
–
On the impact of bike lanes on motor vehicle traffic
With the news that bike lanes will be removed along major roads including, most recently, I share some findings from the US about a decrease in traffic speeds when there are protected bike lanes. The decrease in speeds are associated with a reduction in road crashes, ergo safer streets.
McPherson, K. (June 3, 2024) “Traffic Speeds Decrease When Bike Lane is Present,” Rutgers.edu, https://www.rutgers.edu/news/traffic-speeds-decrease-when-bike-lane-present [Last accessed: 6/8/2024]
To quote from the article:
“They found that the presence of the delineated bike lane made a difference: a 28 percent reduction in average maximum speeds and a 21 percent decrease in average speeds for vehicles turning right. For those heading straight and not turning, a smaller speed reduction of 8 percent was observed. In addition, drivers moving at a perpendicular angle to the bike lane did not slow down.
Marking the bike lanes with cones as a clearly delineated space was more effective at reducing speed than a painted-only bike lane. The painted-only bike lane was associated with a smaller speed reduction of between 11 percent and 15 percent, but only for drivers turning right.
Younes hypothesized that drivers slow down when they see a bike lane marked with the cones because the driving lane is narrower and requires more concentration, and it’s easier to notice cones or planters or some other space delineator than it is to spot painted lines on the road surface.”
Of course, one major element that was probably not considered in their studies is the presence and behavior of motorcycle riders. Motorcycles here frequently enter and use bike lanes whether protected or not. Often they crowd out bicycle users leading to situations where riders of motorized and non-motorized 2-wheelers come into conflict. Still, it would be nice to have a study to determine not just whether there are similar outcomes here but to what extent as well as how motorcycles figure in the study.
–
Extreme turbulence during air travel
Transport-related news last week included a report about a Singapore Airlines B777 jet flying to London from Singapore that had to make an emergency landing in Bangkok due to extreme turbulence experienced. Many people were seriously injured when the plane suddenly ascended (“tilted up” as some news reports state) and then abruptly descended, resulting in people being tossed up and hitting the compartments above their seats. Obviously, these passengers were not wearing their seatbelts at the time. Otherwise, they would have been restrained to their seats. It is likely that the turbulence was not anticipated by the pilot as they usually advise passengers to put on their seat belts if turbulence was expected at any time during a flight.
The incident raises concerns about extreme and sudden turbulence occurring during flights. I guess this may happen anytime and aircraft instruments may not be able to tell the crew about an impending incident like this. Will such an incident have a significant impact on air travel? Perhaps not if these incidents remain rare. There should be records and monitoring of factors or elements leading to such incidents in order to establish the likelihood of these happening. Incident records will also show if there is an increasing frequency as well as the number of people killed and injured. Such information would be vital as more people use aviation for travel and there are more aircraft activity around the world.
As a precaution, it is good practice not to remove your seatbelt while seated in flight. If it’s tight, then loosen it. At least you have some restraint in case of incidents where the aircraft encounters sudden turbulence.
–
Another roadblock for active transport?
The Metro Manila Development Authority (MMDA) recently released what they claim to be their counts of bicycle traffic along major roads in Metro Manila from 2020 to 2023.
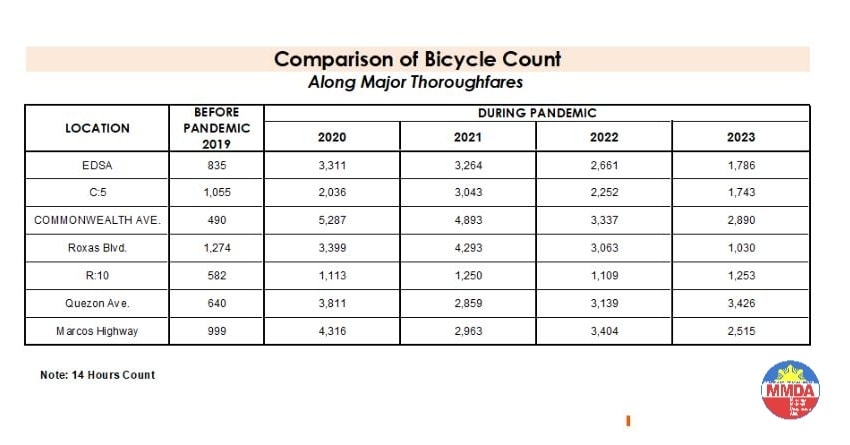
These are supposed to be official data as it is issued by the government agency in-charge of traffic management for Metro Manila roads (aside from its other functions and roles). What are not stated, and are actually very important details, are the locations of the counts and when the counts were conducted. The Traffic Engineering Center (TEC) that was under the DPWH and currently with the MMDA used to publish traffic volume maps for major roads in Metro Manila. So along EDSA, for example, the volume per section are shown on the map. The same for other major roads like Commonwealth, Quezon Avenue and SLEX. The thicker lines mean higher volumes along those sections, and vice versa. However, they did not consciously count bicycles (only motor vehicles) and perhaps MMDA only started counting during the pandemic (i.e., 2020). So there is no one value to represent a road. And counts vary over time of day, day of the week and even throughout the year (i.e., monthly variations).
There were many reactions to the MMDA’s posting of the data and most were critical and even derided the agency for what to them appeared to be inaccurate data. The problem is that it seems there are no other counts that can validate and perhaps refute the MMDA data. Previous bike counts were not conducted according to how the MMDA and DPWH count vehicles. That is, counts are typically done over a 14 or 16-hour period and ideally on several days in a year. Expansion and conversion factors are applied based on established stations along major roads that are supposed to have more frequent if not continuous counts. This methodology is how Annual Average Daily Traffic (AADT) is computed. Call it car-centric if you like but the methodology is very much applicable to bicycles as well. Peak hour counts for bikes are not enough and the peak hour factor for motor vehicles does not apply to bicycles (if this is to be used to expand/convert peak volumes to daily values). In fact, if you go into the math, there should be a peak hour factor for each type of vehicle considering each vehicle’s volume will vary differently over time. So yes, the solution here is to conduct bicycle counts according to how MMDA or DPWH counts vehicles and these should be done along several stations along major roads (e.g., those in the table above) to validate the MMDA counts.
More on this topic in the next post!
–
Article share: on making more affordable neighborhoods
I’ve been commenting about how transportation cannot be isolated and the need to relate it to other factors such as housing or home location choice. The latter though is also affected by other factors as well that affect the affordability of homes near the city centers or CBDs where workplaces and schools are located. The result of course is sprawl or the encouragement of sprawl. Private companies take advantage of this or contribute to this ‘encouragement’ by developing land farther away from the center. Thus, for Metro Manila’s case, many people reside in the peripheral provinces of Bulacan, Rizal, Laguna and Cavite. There are even those who choose to reside in Pampanga, Bataan and Batangas.
Kayatekin, C.S. and Sanmiguel, L.U. (April 16, 2024) ” ‘Urban form’ and the housing crisis: can streets and buildings make a neighborhood more affordable?” The Conversation, https://theconversation.com/urban-form-and-the-housing-crisis-can-streets-and-buildings-make-a-neighbourhood-more-affordable-224108 [Last accessed: 4/23/2024]
Quoting from the article:
“Our main finding was that the bottom-up districts we looked at had, overall, more small-scale apartments. The reason is simple: they had more small-scale buildings, built on small-scale plots. Once divided into apartments, this produces small apartments – homes in the bottom-up areas were 10% to 23.1% smaller than their top-down counterparts. This also made their real estate markets for small homes more competitive, and therefore more affordable.
However, our study showed there is nothing inherently magical about bottom-up areas. Their more intricate housing stock has little to do with the layout of streets and blocks, and a lot to do with how that land is built upon.
Plot size appears to be the deciding factor: the districts with greater numbers of small buildings built on small plots supported a denser and more affordable housing stock, regardless of whether they were top-down or bottom-up.
Older bottom-up areas seem to naturally lend themselves to having more small-scale plots. This is likely due to the incremental development of these areas, and the complex land ownership patterns that developed as a result. However, there is no reason why a top-down area cannot be designed to replicate these characteristics.”
–
Planning for Accessibility: Proximity is More Important than Mobility
Here is a quick share of another very informative article that discusses the importance of proximity and more dense development in order to reduce car dependence.
Source: Planning for Accessibility: Proximity is More Important than Mobility
Here are some excerpts from the article:
“This shows that proximity is much more important than mobility in providing accessibility: location, location, location. For the last century, our transportation planning practices have contradicted this principle. Transportation agencies built urban highways that destroyed and degraded accessible and multimodal neighborhoods to benefit suburban motorists. This was racist and classist, but the mechanism was the way that transportation planners valued increased traffic speeds, measured as travel time savings, while ignoring the loss of accessibility imposed on urban neighborhood residents.
Of course, many other factors affect people’s transportation and neighborhood preferences. Some people need their cars for work or after-work activities, and not everybody can bicycle or use transit even if it is available. However, surveys such as the National Association of Realtor’s National Community Preference Survey indicate that many people would prefer living in more compact, walkable neighborhoods than they currently do but cannot due to a lack of supply.”
Such articles are a must read for those who want to understand why government needs to invest in land at or near the CBDs, and develop that land so people will not need to reside far from their workplaces and schools. Truly, there are many other factors affecting transport preferences or mode choice. Housing is one such factor that we continue to treat separately from transport. It is very (prohibitively) expensive to buy or rent in the city particularly in or near the CBDs. The result is people opting to purchase or rent homes in the suburbs. It doesn’t help that developers are also actively promoting subdivisions there and therefore are contributing to sprawl that puts so much pressure on transportation systems.
–
On kamote riders
Much has been written and reported about the so-called ‘kamote’ riders. These are motorcyclists who have the propensity for risky behavior including reckless maneuvers on the road. Such often places them in harm’s way whether they are conscious about the actions or not. I see them everyday during my commutes including but not limited to those who counterflow, speed, race, zig-zag through moving traffic, and use the bicycle lanes or pedestrian sidewalks.
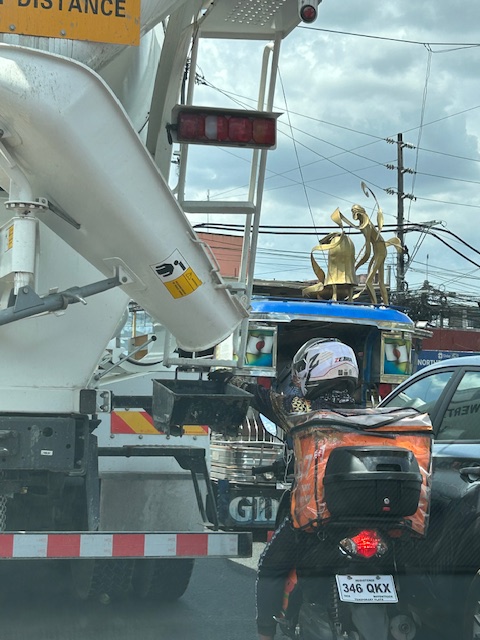 The not so obvious kamote rider positioning himself at the downspout of a concrete mixer.
Not all motorcycle riders are kamote. However, there is a significant number of them out there that put other road users in risky situations. They also contribute to a lot of damage to property as evidenced by a lot of vehicles, especially cars, that have the signature scratches, dinks and dents after being sideswiped or bumped by motorcycles. Such behavior can actually be corrected if the Land Transportation Office (LTO) would be stricter with licensing – requiring more in terms of rider training and certification as well as testing. Traffic law enforcement is also critical here because behavior change can only be done and effective if enforcers are firm. A friend made the observation that law enforcers themselves are the first to violate rules and regulations or bend them in their favor. That sends a wrong signal and would only encourage more ‘pasaway’ and ‘kamote’ riders.
Of course, there are also kamote drivers and cyclists. But those are the topics for future posts.
–
