
Home » Policy (Page 6)
Category Archives: Policy
On a city’s part in making bike and scooter shares succeed
I recently posted about Bonifacio Global City (BGC) and the bike and scooter share they have there. There was one bike share there and in the Ortigas Center before the pandemic. But those fizzled out for various reasons including not so many people using it. Here’s a report on bike and scooter shares in the US and the observation that cities are not making it easy for these to succeed:
Tu, M. (July 29, 2024) “Report: People Want to Ride Shared Bikes and Scooters, But Cities aren’t Making it Easy,” Next City [Last accessed: 8/2/2024]
To quote from the article:
“Even long standing bike share systems can fall victim to the whims of leaders who are not committed to investing in greener modes of transportation. Houston recently lost its bike share system, ending 12 years of operations for BCycle after a new mayor hostile to bike and pedestrian improvements overhauled the METRO Houston board.
If cities want to encourage people to ride a bike or scooter instead of getting into a car, they will have to figure out how to fund it — or in other words, put their money where their carbon reduction goals are.”
Though we’re still a long way to achieving the bike and scooter shares they have in other countries such as the US, we should be wary about their experiences. The lessons learned here should already be in mind to those who will be setting up bike and/or scooter shares in Philippine cities. There is a demand for these facilities as people find cycling convenient and safer in some cities. However, LGUs need to invest more and commit to safer and more connected bicycle facilities in order to convince more people to use this active transport mode instead of motorized transport including motorcycle taxis.
–
SPRINT principles for bicycles
Here is the link to how to improve your city’s or municipality’s bicycle facilities based on scores guided by the SPRINT principles: https://cityratings.peopleforbikes.org/create-great-places
SPRINT stands for:
S -Safe Speeds
P-Protected Bike Lanes
R-Reallocated Space
I-Intersection Treatments
N-Network Connections
T-Trusted Data
The site provides links and examples of good practices of actual bike projects in the US. Many of these can be replicated or adapted to Philippine conditions. These are something that the active transport section of the Department of Transportation (DOTr) should look into and perhaps provide a reference for developing and improving bicycle facilities in the country.
–
On a ‘tipping point’ for bikeability in cities
Here’s a nice article on bikeability and pertains to cities in the United States that developed bikeways or bike lanes during the pandemic. Like many cities that have ‘discovered’ cycling as a viable mode of transport particularly for commuting during the COVID-19 pandemic, it is postulated that there would be a threshold when people would switch to cycling and/or demand for more cycling facilities.
Wilson, K. (June 25, 2024) “Has Your City Passed the ‘Bikeability Tipping Point’?,” StreetsBlog USA, https://usa.streetsblog.org/2024/06/25/has-your-city-passed-the-bikeability-tipping-point [Last accessed: 7/2/2024]
To quote from the article:
“A whopping 183 American communities achieved a score of 50 or higher on PeopleForBikes annual City Ratings this year, up from just 33 in 2019. The means 183 communities have scored at least half of the available points on the group’s signature “SPRINT” rubric that includes such measures as protected bike lanes, safe intersection treatments, and reduced speed limits that are unlikely to kill a cyclist in the event of a crash, among other factors.
And when a city clears that 50-point threshold, the authors of the ratings say that its local bike culture has firmly taken root — and that every new roadway improvement will inspire more improvements, rather than a fierce fight against a car-dominated status quo.
“Once you’ve hit 50, your city probably has a pretty good low-stress bike network,” said Martina Haggerty, the senior director of local innovation at PeopleForBikes. “[That’s] not to say that there aren’t still improvements to be made [but it] probably means that more people are riding bikes in those communities because they feel safe and comfortable. And when more people start riding bikes, those people tend to become advocates for better bike infrastructure and for pro-bike policies, which, [in turn,] will get more people riding.”
There are many links found in the article itself that are “click worthy”. I recommend the reader to explore the rubric from PeopleForBikes and see for yourself how this can be adopted for your city. Is such a rubric applicable to the Philippines? Perhaps, but there would be a need to assess the the situation in each city or municipality. So far, there have been mixed reviews among cities, especially those that appeared to have been more progressive and were more aggressive than others in putting up bicycle facilities including bike lanes. Perhaps the rubric can be applied to see how our LGUs measure up?
–
On the idea of congestion pricing
I purposely titled this post to include the word ‘idea’ as congestion pricing is still very much like that in the Philippines. It is a reality in some part of the world particularly in Singapore where its Electronic Road Pricing (ERP) has evolved and improved over the years. Its success though seems to be an exceptional case that has not been replicated elsewhere where conditions are not exactly like the city state’s.
Here is an article that recently came out from The Washington Post about the New York Governor’s decision to backtrack on the proposed congestion pricing initiative in New York City:
McArdle, M. (June 12, 2024) “People hate traffic. They also hate this great idea to clear it,” The Washington Post, https://www.washingtonpost.com/opinions/2024/06/12/congestion-pricing-great-idea-people-hate/ [Last accessed: 6/14/2024]
To quote from the article:
“Roads are a scarce good; you can fit only so many cars on a road at one time, and fewer if you would like those cars to go somewhere. When roads are “free,” we are forced to fall back on a more costly and inefficient strategy: sitting in traffic. This wastes valuable human time and inflicts noise and pollution on everyone nearby. Far better to charge a modest price that inspires some drivers to carpool and others to take public transit or shop nearer to home, until supply and demand are balanced and traffic flows easily…
In political disputes, a discrete group facing highly concentrated costs often defeats a larger public interest that conveys a small individual benefit to everybody — such as being able to move around the city faster when you really need to. This is particularly true in the American system, which is designed to empower angry minorities. And it’s especially true when they’re abetted by status quo bias and a sympathetic majority, as in this case.
Complain all you want about selfish suburban drivers or the Metropolitan Transit Authority’s bloated cost structure or Hochul’s cowardice; the biggest obstacle to congestion pricing is that almost two-thirds of New York City residents have told pollsters they oppose it — in a city where less than half of all households even own a car. A more technocratic, less democratically responsive government might have been able to ram it through, and perhaps in time everyone would have come to like it. But in fractious America, with all its political veto points, congestion pricing is doomed by the reality that people hate slapping prices on things — especially if they have to pay them.”
There is a congestion pricing proposal in Baguio City and we don’t know yet how this will go. I don’t have the details yet except that a private company whose core business is tollways is involved. Will this be a model or a proof of concept? Or will it just go the way of a typical tollway where users are those who are willing to pay and which would eventually congest if most of the current users pay and use it anyway? Will the funds generated be used to develop a more efficient transport system for Baguio, eventually leading and contributing to less congested streets? That would also mean eventually less revenues from the congestion pricing scheme and probably lead to it being unnecessary.
–
On the impact of bike lanes on motor vehicle traffic
With the news that bike lanes will be removed along major roads including, most recently, I share some findings from the US about a decrease in traffic speeds when there are protected bike lanes. The decrease in speeds are associated with a reduction in road crashes, ergo safer streets.
McPherson, K. (June 3, 2024) “Traffic Speeds Decrease When Bike Lane is Present,” Rutgers.edu, https://www.rutgers.edu/news/traffic-speeds-decrease-when-bike-lane-present [Last accessed: 6/8/2024]
To quote from the article:
“They found that the presence of the delineated bike lane made a difference: a 28 percent reduction in average maximum speeds and a 21 percent decrease in average speeds for vehicles turning right. For those heading straight and not turning, a smaller speed reduction of 8 percent was observed. In addition, drivers moving at a perpendicular angle to the bike lane did not slow down.
Marking the bike lanes with cones as a clearly delineated space was more effective at reducing speed than a painted-only bike lane. The painted-only bike lane was associated with a smaller speed reduction of between 11 percent and 15 percent, but only for drivers turning right.
Younes hypothesized that drivers slow down when they see a bike lane marked with the cones because the driving lane is narrower and requires more concentration, and it’s easier to notice cones or planters or some other space delineator than it is to spot painted lines on the road surface.”
Of course, one major element that was probably not considered in their studies is the presence and behavior of motorcycle riders. Motorcycles here frequently enter and use bike lanes whether protected or not. Often they crowd out bicycle users leading to situations where riders of motorized and non-motorized 2-wheelers come into conflict. Still, it would be nice to have a study to determine not just whether there are similar outcomes here but to what extent as well as how motorcycles figure in the study.
–
Another roadblock for active transport?
The Metro Manila Development Authority (MMDA) recently released what they claim to be their counts of bicycle traffic along major roads in Metro Manila from 2020 to 2023.
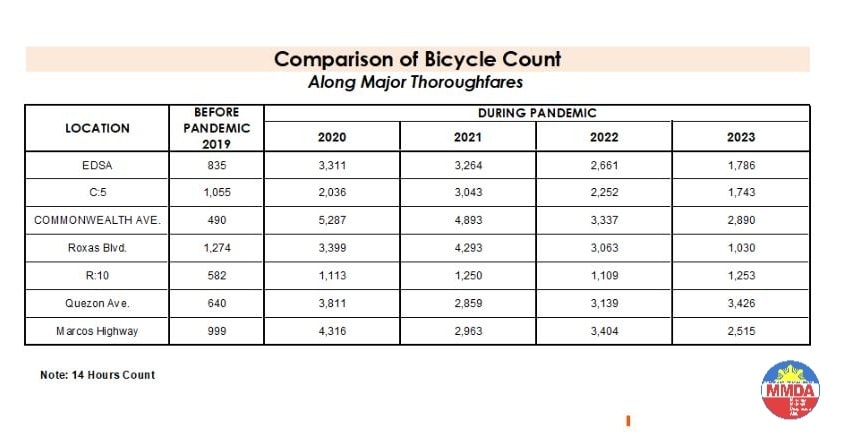
These are supposed to be official data as it is issued by the government agency in-charge of traffic management for Metro Manila roads (aside from its other functions and roles). What are not stated, and are actually very important details, are the locations of the counts and when the counts were conducted. The Traffic Engineering Center (TEC) that was under the DPWH and currently with the MMDA used to publish traffic volume maps for major roads in Metro Manila. So along EDSA, for example, the volume per section are shown on the map. The same for other major roads like Commonwealth, Quezon Avenue and SLEX. The thicker lines mean higher volumes along those sections, and vice versa. However, they did not consciously count bicycles (only motor vehicles) and perhaps MMDA only started counting during the pandemic (i.e., 2020). So there is no one value to represent a road. And counts vary over time of day, day of the week and even throughout the year (i.e., monthly variations).
There were many reactions to the MMDA’s posting of the data and most were critical and even derided the agency for what to them appeared to be inaccurate data. The problem is that it seems there are no other counts that can validate and perhaps refute the MMDA data. Previous bike counts were not conducted according to how the MMDA and DPWH count vehicles. That is, counts are typically done over a 14 or 16-hour period and ideally on several days in a year. Expansion and conversion factors are applied based on established stations along major roads that are supposed to have more frequent if not continuous counts. This methodology is how Annual Average Daily Traffic (AADT) is computed. Call it car-centric if you like but the methodology is very much applicable to bicycles as well. Peak hour counts for bikes are not enough and the peak hour factor for motor vehicles does not apply to bicycles (if this is to be used to expand/convert peak volumes to daily values). In fact, if you go into the math, there should be a peak hour factor for each type of vehicle considering each vehicle’s volume will vary differently over time. So yes, the solution here is to conduct bicycle counts according to how MMDA or DPWH counts vehicles and these should be done along several stations along major roads (e.g., those in the table above) to validate the MMDA counts.
More on this topic in the next post!
–
On non-roadway traffic deaths and incidents
I found this interesting article about non-roadway crashes or incidents that may cause deaths. These are often recorded in buildings including parking lots or facilities but are not generally collected and reported by governments as part of road crash data.
Wilson, K. (April 18, 2024) “Why Does the Vision Zero Movement Stop At the Edge of the Road?,” Streetsblog USA, https://usa.streetsblog.org/2024/04/18/why-does-the-vision-zero-movement-stop-at-the-edge-of-the-road [Last accessed: 4/28/2024]
From the article:
“According to the latest report from the National Highway Traffic Safety Administration, a shocking 3,990 people died in car crashes that occurred outside of the traditional transportation space in 2021, the last year for which data is available. One-quarter of those people were outside vehicles, including, pedestrians, cyclists, wheelchair users, and even children simply wishing their parents goodbye before they were accidentally run over by the caregivers who loved them most; all lost their lives after they were struck by drivers on private property, like parking lots, driveways, drive-thrus, and private roads.”
These crashes very likely contribute to under-reporting. One wonders, for example, how many incidents occur in mall parking lots, schools and subdivisions. Recall the incident in Ateneo years ago when a child got ran over and killed as students were being dropped off in the morning. Surely there are other incidents though not involving deaths, and these need to be recorded among traffic incidents. The deaths need to be included in the reports. These are important information to complete the picture of road traffic safety in any country including the Philippines.
–
Article share: on making more affordable neighborhoods
I’ve been commenting about how transportation cannot be isolated and the need to relate it to other factors such as housing or home location choice. The latter though is also affected by other factors as well that affect the affordability of homes near the city centers or CBDs where workplaces and schools are located. The result of course is sprawl or the encouragement of sprawl. Private companies take advantage of this or contribute to this ‘encouragement’ by developing land farther away from the center. Thus, for Metro Manila’s case, many people reside in the peripheral provinces of Bulacan, Rizal, Laguna and Cavite. There are even those who choose to reside in Pampanga, Bataan and Batangas.
Kayatekin, C.S. and Sanmiguel, L.U. (April 16, 2024) ” ‘Urban form’ and the housing crisis: can streets and buildings make a neighborhood more affordable?” The Conversation, https://theconversation.com/urban-form-and-the-housing-crisis-can-streets-and-buildings-make-a-neighbourhood-more-affordable-224108 [Last accessed: 4/23/2024]
Quoting from the article:
“Our main finding was that the bottom-up districts we looked at had, overall, more small-scale apartments. The reason is simple: they had more small-scale buildings, built on small-scale plots. Once divided into apartments, this produces small apartments – homes in the bottom-up areas were 10% to 23.1% smaller than their top-down counterparts. This also made their real estate markets for small homes more competitive, and therefore more affordable.
However, our study showed there is nothing inherently magical about bottom-up areas. Their more intricate housing stock has little to do with the layout of streets and blocks, and a lot to do with how that land is built upon.
Plot size appears to be the deciding factor: the districts with greater numbers of small buildings built on small plots supported a denser and more affordable housing stock, regardless of whether they were top-down or bottom-up.
Older bottom-up areas seem to naturally lend themselves to having more small-scale plots. This is likely due to the incremental development of these areas, and the complex land ownership patterns that developed as a result. However, there is no reason why a top-down area cannot be designed to replicate these characteristics.”
–
Planning for Accessibility: Proximity is More Important than Mobility
Here is a quick share of another very informative article that discusses the importance of proximity and more dense development in order to reduce car dependence.
Source: Planning for Accessibility: Proximity is More Important than Mobility
Here are some excerpts from the article:
“This shows that proximity is much more important than mobility in providing accessibility: location, location, location. For the last century, our transportation planning practices have contradicted this principle. Transportation agencies built urban highways that destroyed and degraded accessible and multimodal neighborhoods to benefit suburban motorists. This was racist and classist, but the mechanism was the way that transportation planners valued increased traffic speeds, measured as travel time savings, while ignoring the loss of accessibility imposed on urban neighborhood residents.
Of course, many other factors affect people’s transportation and neighborhood preferences. Some people need their cars for work or after-work activities, and not everybody can bicycle or use transit even if it is available. However, surveys such as the National Association of Realtor’s National Community Preference Survey indicate that many people would prefer living in more compact, walkable neighborhoods than they currently do but cannot due to a lack of supply.”
Such articles are a must read for those who want to understand why government needs to invest in land at or near the CBDs, and develop that land so people will not need to reside far from their workplaces and schools. Truly, there are many other factors affecting transport preferences or mode choice. Housing is one such factor that we continue to treat separately from transport. It is very (prohibitively) expensive to buy or rent in the city particularly in or near the CBDs. The result is people opting to purchase or rent homes in the suburbs. It doesn’t help that developers are also actively promoting subdivisions there and therefore are contributing to sprawl that puts so much pressure on transportation systems.
–
On kamote riders
Much has been written and reported about the so-called ‘kamote’ riders. These are motorcyclists who have the propensity for risky behavior including reckless maneuvers on the road. Such often places them in harm’s way whether they are conscious about the actions or not. I see them everyday during my commutes including but not limited to those who counterflow, speed, race, zig-zag through moving traffic, and use the bicycle lanes or pedestrian sidewalks.
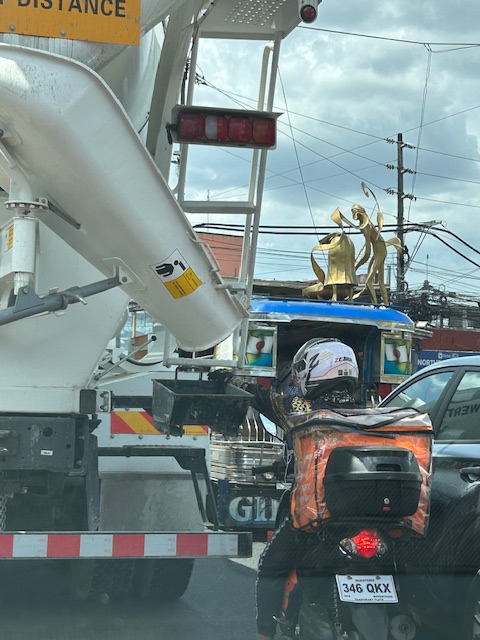 The not so obvious kamote rider positioning himself at the downspout of a concrete mixer.
Not all motorcycle riders are kamote. However, there is a significant number of them out there that put other road users in risky situations. They also contribute to a lot of damage to property as evidenced by a lot of vehicles, especially cars, that have the signature scratches, dinks and dents after being sideswiped or bumped by motorcycles. Such behavior can actually be corrected if the Land Transportation Office (LTO) would be stricter with licensing – requiring more in terms of rider training and certification as well as testing. Traffic law enforcement is also critical here because behavior change can only be done and effective if enforcers are firm. A friend made the observation that law enforcers themselves are the first to violate rules and regulations or bend them in their favor. That sends a wrong signal and would only encourage more ‘pasaway’ and ‘kamote’ riders.
Of course, there are also kamote drivers and cyclists. But those are the topics for future posts.
–
