
Home » Transport Planning
Category Archives: Transport Planning
Some thoughts on bus transportation for Metro Manila and beyond
There are two recent news items about buses in Metro Manila and adjacent areas:
- A proposed study on bus lanes for Quezon Avenue, Ortigas Avenue and C5
- Bus transport supplement for LRT Line 2
Did you know that there was a Pre-Feasibility for Bus Rapid Transit (BRT) along several thoroughfares in Metro Manila back in 2007? I am sharing this paper presented at the Transportation Science Society of the Philippines (TSSP) 2014 conference that synthesizes the references including the 2007 Pre-Feasibility Study on Bus Rapid Transit (BRT) for Metro Manila (supported by the USAID) and the 2011 Mega Manila Public Transportation Planning Support System (MMPTPSS) Study funded by the then DOTC. I hope these studies, which are still very relevant though no longer recent, can be utilized. There is no need to reinvent the proverbial wheel.
Sigua, R.G. (2014) “Identification of BRT Corridors in Metro Manila,” Proceedings of the 22nd Annual Conference of the Transportation Science Society of the Philippines, Iloilo City.
LRT Line 2 is an example of government not having the foresight of acquiring new rolling stock (i.e., trains) despite passenger demand steadily increasing over the years. Yet here we are and the old train sets are now deteriorating with some already retired. And then there is the proposal and study by the LTFRB and LRTA about buses supplementing the Line 2 operations. A quick check and there is already a bus service supplementing Line 1 – the Antipolo-Cubao route that is also serviced by jeepneys. This existing route can be tweaked or expanded so there are several lines serving not just Antipolo but also other Rizal towns and the City of Marikina. From Cubao there are already jeepney routes parallel to Line 2. Perhaps instead of just jeepneys, these can be rationalized to buses, which have higher capacities than PUJs? I don’t think you need to have a deep dive on this if you are familiar with public transportation along the Line 2 corridor.
–
Article share – Planning for Love, Part 2: What happens to dating in a car-centric world?
I shared the first part of a series relating the built environment with love (or dating). The second part is also very interesting as it focuses on the impacts of car-centricity. To quote from the article:
“Everyone across both groups said they’d ideally like to meet their partner in person, organically, putting spontaneous public interactions and friends at the top of the list while dating apps and social media fell to the bottom.
In practice, however, drivers were getting far fewer spontaneous public encounters than they wanted, turning to social media for dating far more than they’d like.
For non-drivers, their actual dating life and dating ideals were much more in sync: public encounters and social media use both happened at nearly the rate they preferred. One exception was meeting through friends and family, which happened less often than they would’ve liked.”
Planning for Love, Part 2: What happens to dating in a car-centric world?
Source: Planning for Love, Part 2: What happens to dating in a car-centric world?
–
Article share – Planning for Love, Part 1: The link between urban form and dating
There’s this interesting series on the relationship between urban form and dating. To quote from Part 1:
“Even though dating is considered a lesser concern than other social issues, it’s one of the many ways humans seek love and connection. Love, in whatever form it takes, remains one of the most fundamental parts of being human.
So, if the design of cities shapes just about every form of social life, it seems worth finding out whether cities shape this one too.”
Here is the article:
A brief exploration of dating through history highlights how the spaces in which we live and move shape our social lives and relationships.
Source: Planning for Love, Part 1: The link between urban form and dating
Congestion Costing Reality Check, Part 1: Congestion evaluation best practices
Here’s a quick share of an article from Todd Litman on congestion evaluation:
Widely cited studies claim that traffic congestion is a huge and growing problem. They exaggerate. Let’s examine how to correctly calculate congestion costs and roadway expansion benefits.
Source: Congestion Costing Reality Check, Part 1: Congestion evaluation best practices
Trip purpose, Antipolo City
In the same workshop with Antipolo LGU staff, the following graph was presented showing the purposes of trips made by residents of the city. The data was gathered with the assistance of barangays, which deployed personnel to do a version of the household information surveys (HIS) usually conducted to collect data on transportation and trip making among residents.
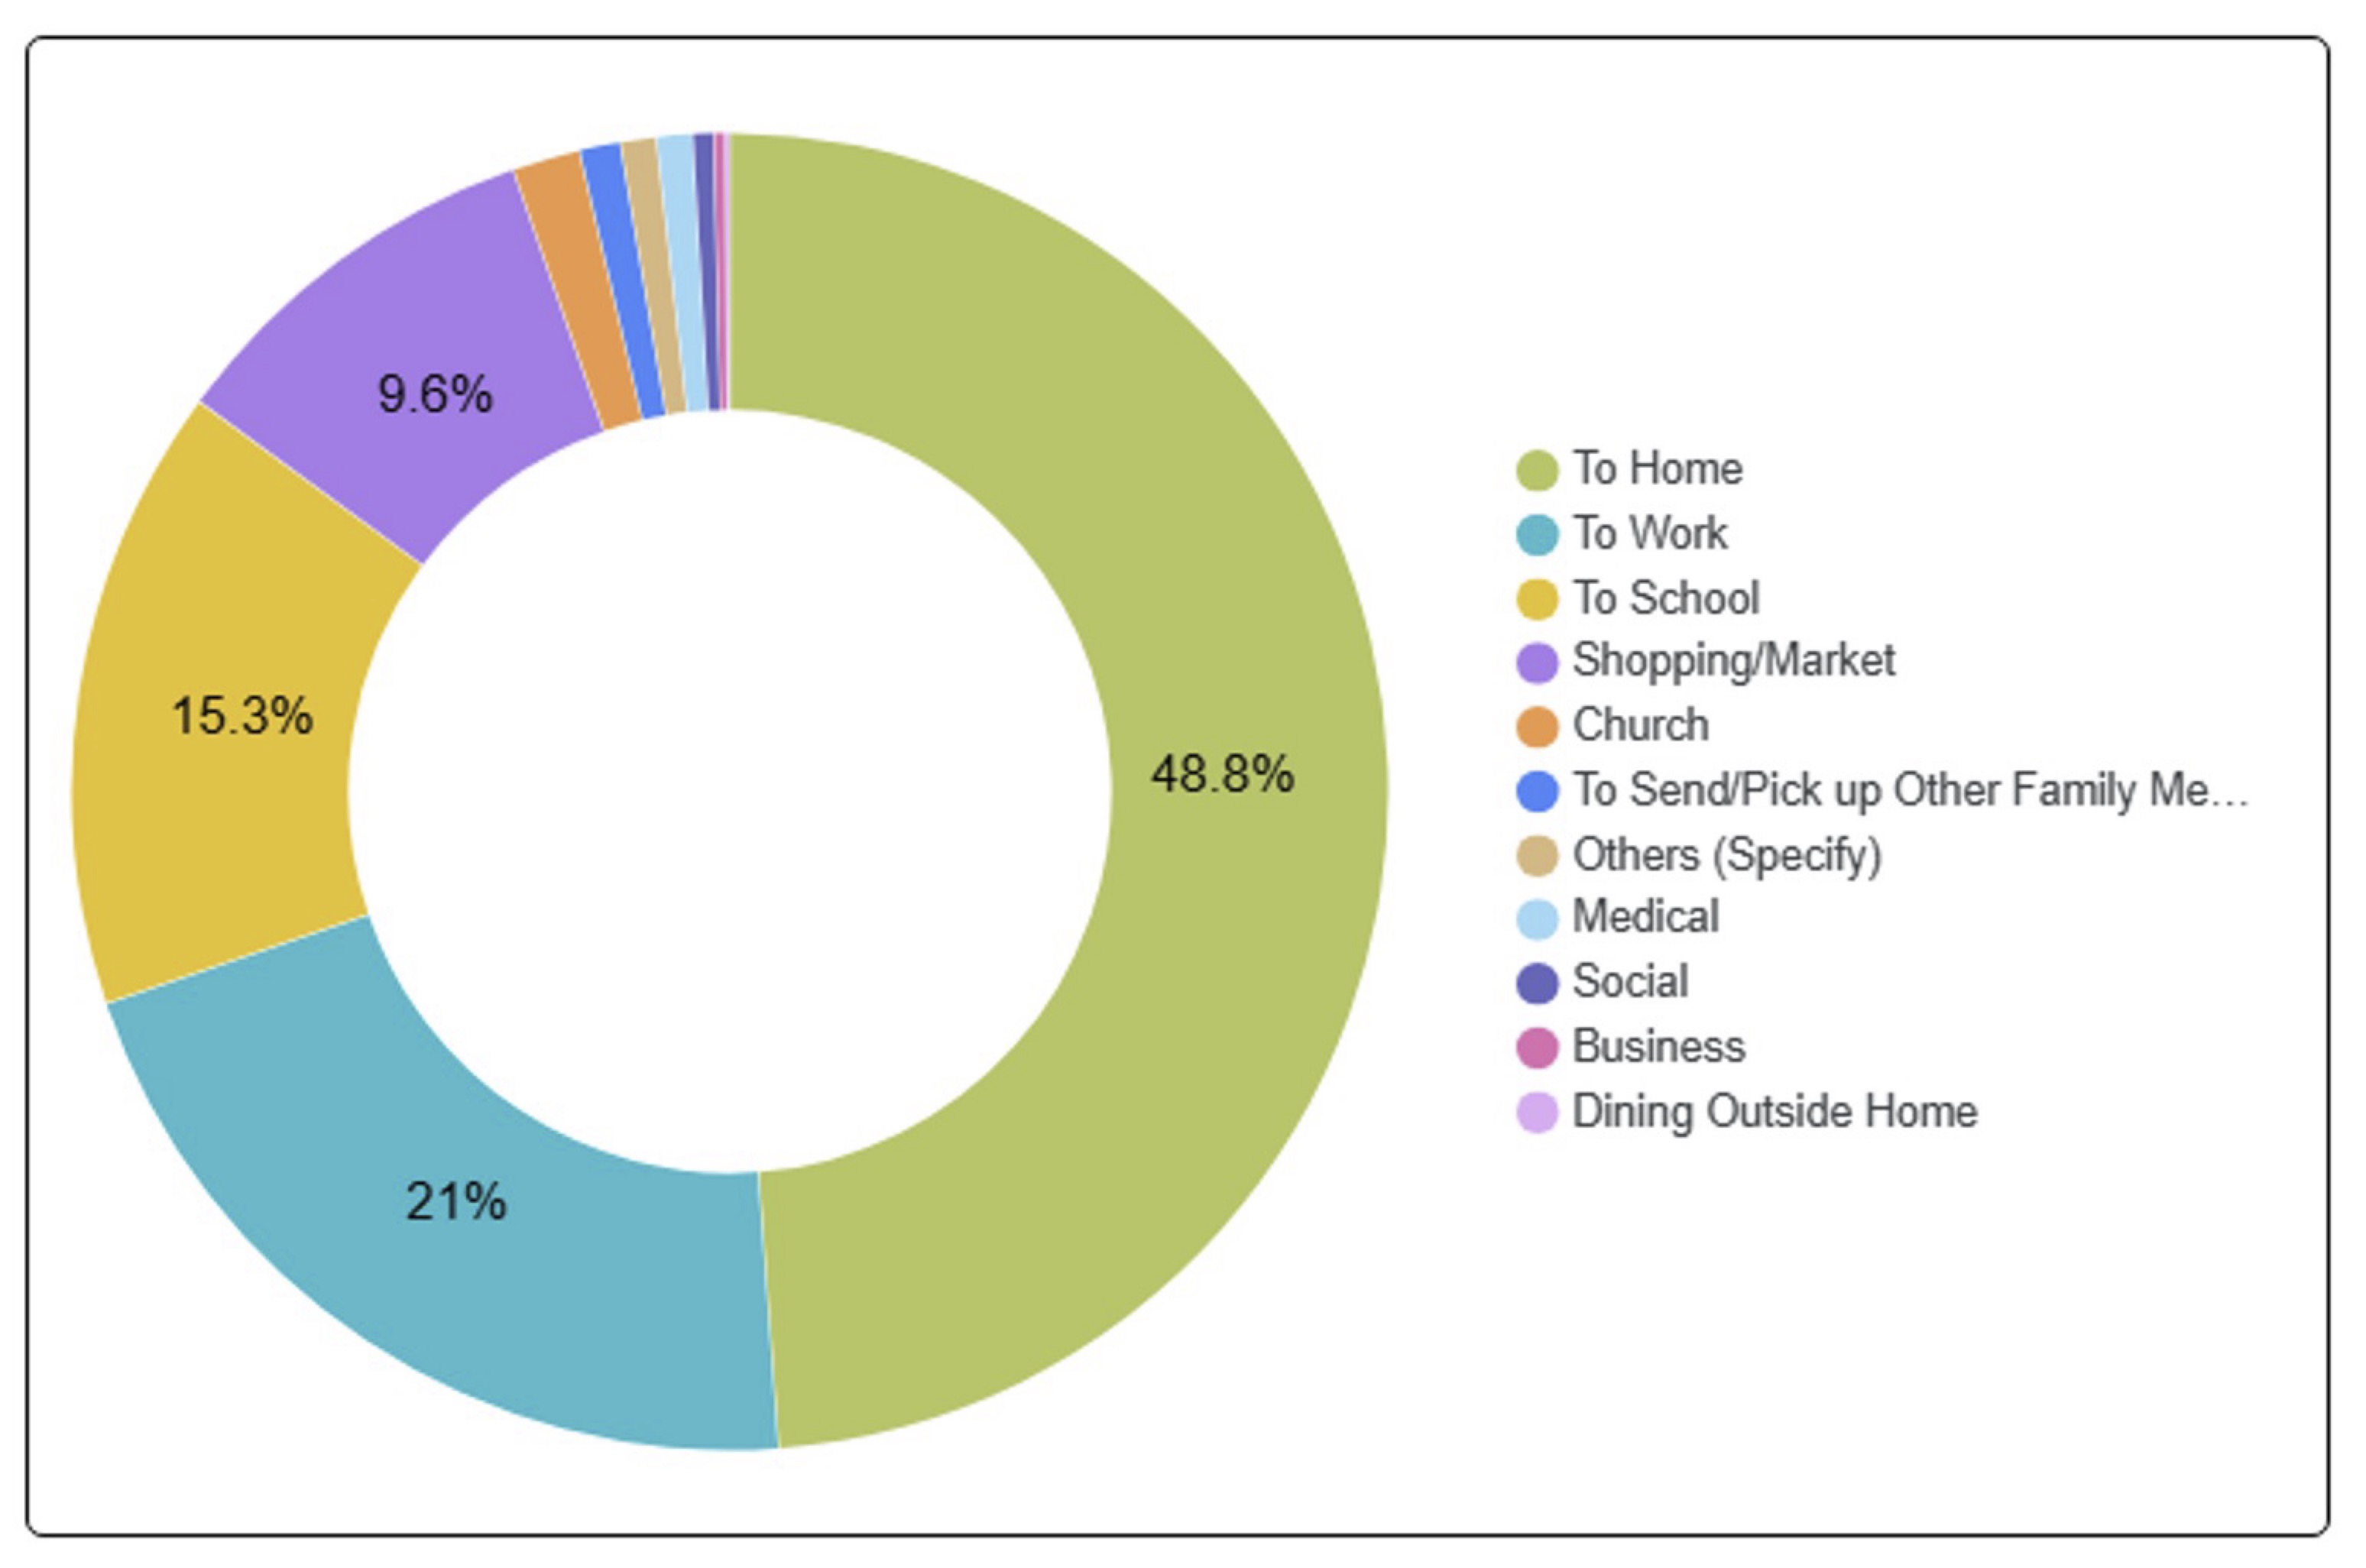
It is important to note that most if not all trips eventually end up at home (i.e., coming home from the workplace, school, market, etc.). Thus we can interpret the graph in a way where we can derive the trip purpose other than “to home”. For example, perhaps the real % of work trips is not 21% but 41.0% of trips made other than “going home.” School trips come in second with 29.9% of trips. Third would be shopping trips at 18.8%. These three combine for 89.7% of all trips made by Antipolo City residents. Work and school trips are most likely the most regular or frequent trips. These are the purposes associated with daily commutes whether by public or private transportation. In the next post, I will share data on mode share and try to relate the latter to the trip purpose.
–
Travel time maps for Antipolo City
Yesterday, we facilitated a workshop for Antipolo City where technical staff of the city presented on the outcomes of various activities related to the formulation of a Sustainable Urban Mobility Plan (SUMP) for the city. One interesting output from one of the groups is this map showing the travel times within selected driving times with the destination being the Antipolo Shrine (“Antipolo Simbahan” if you will refer to the PUV signboards of those plying routes to Antipolo). The maps are the equivalent of travel time contour maps that can be generated with travel speed or travel time data.
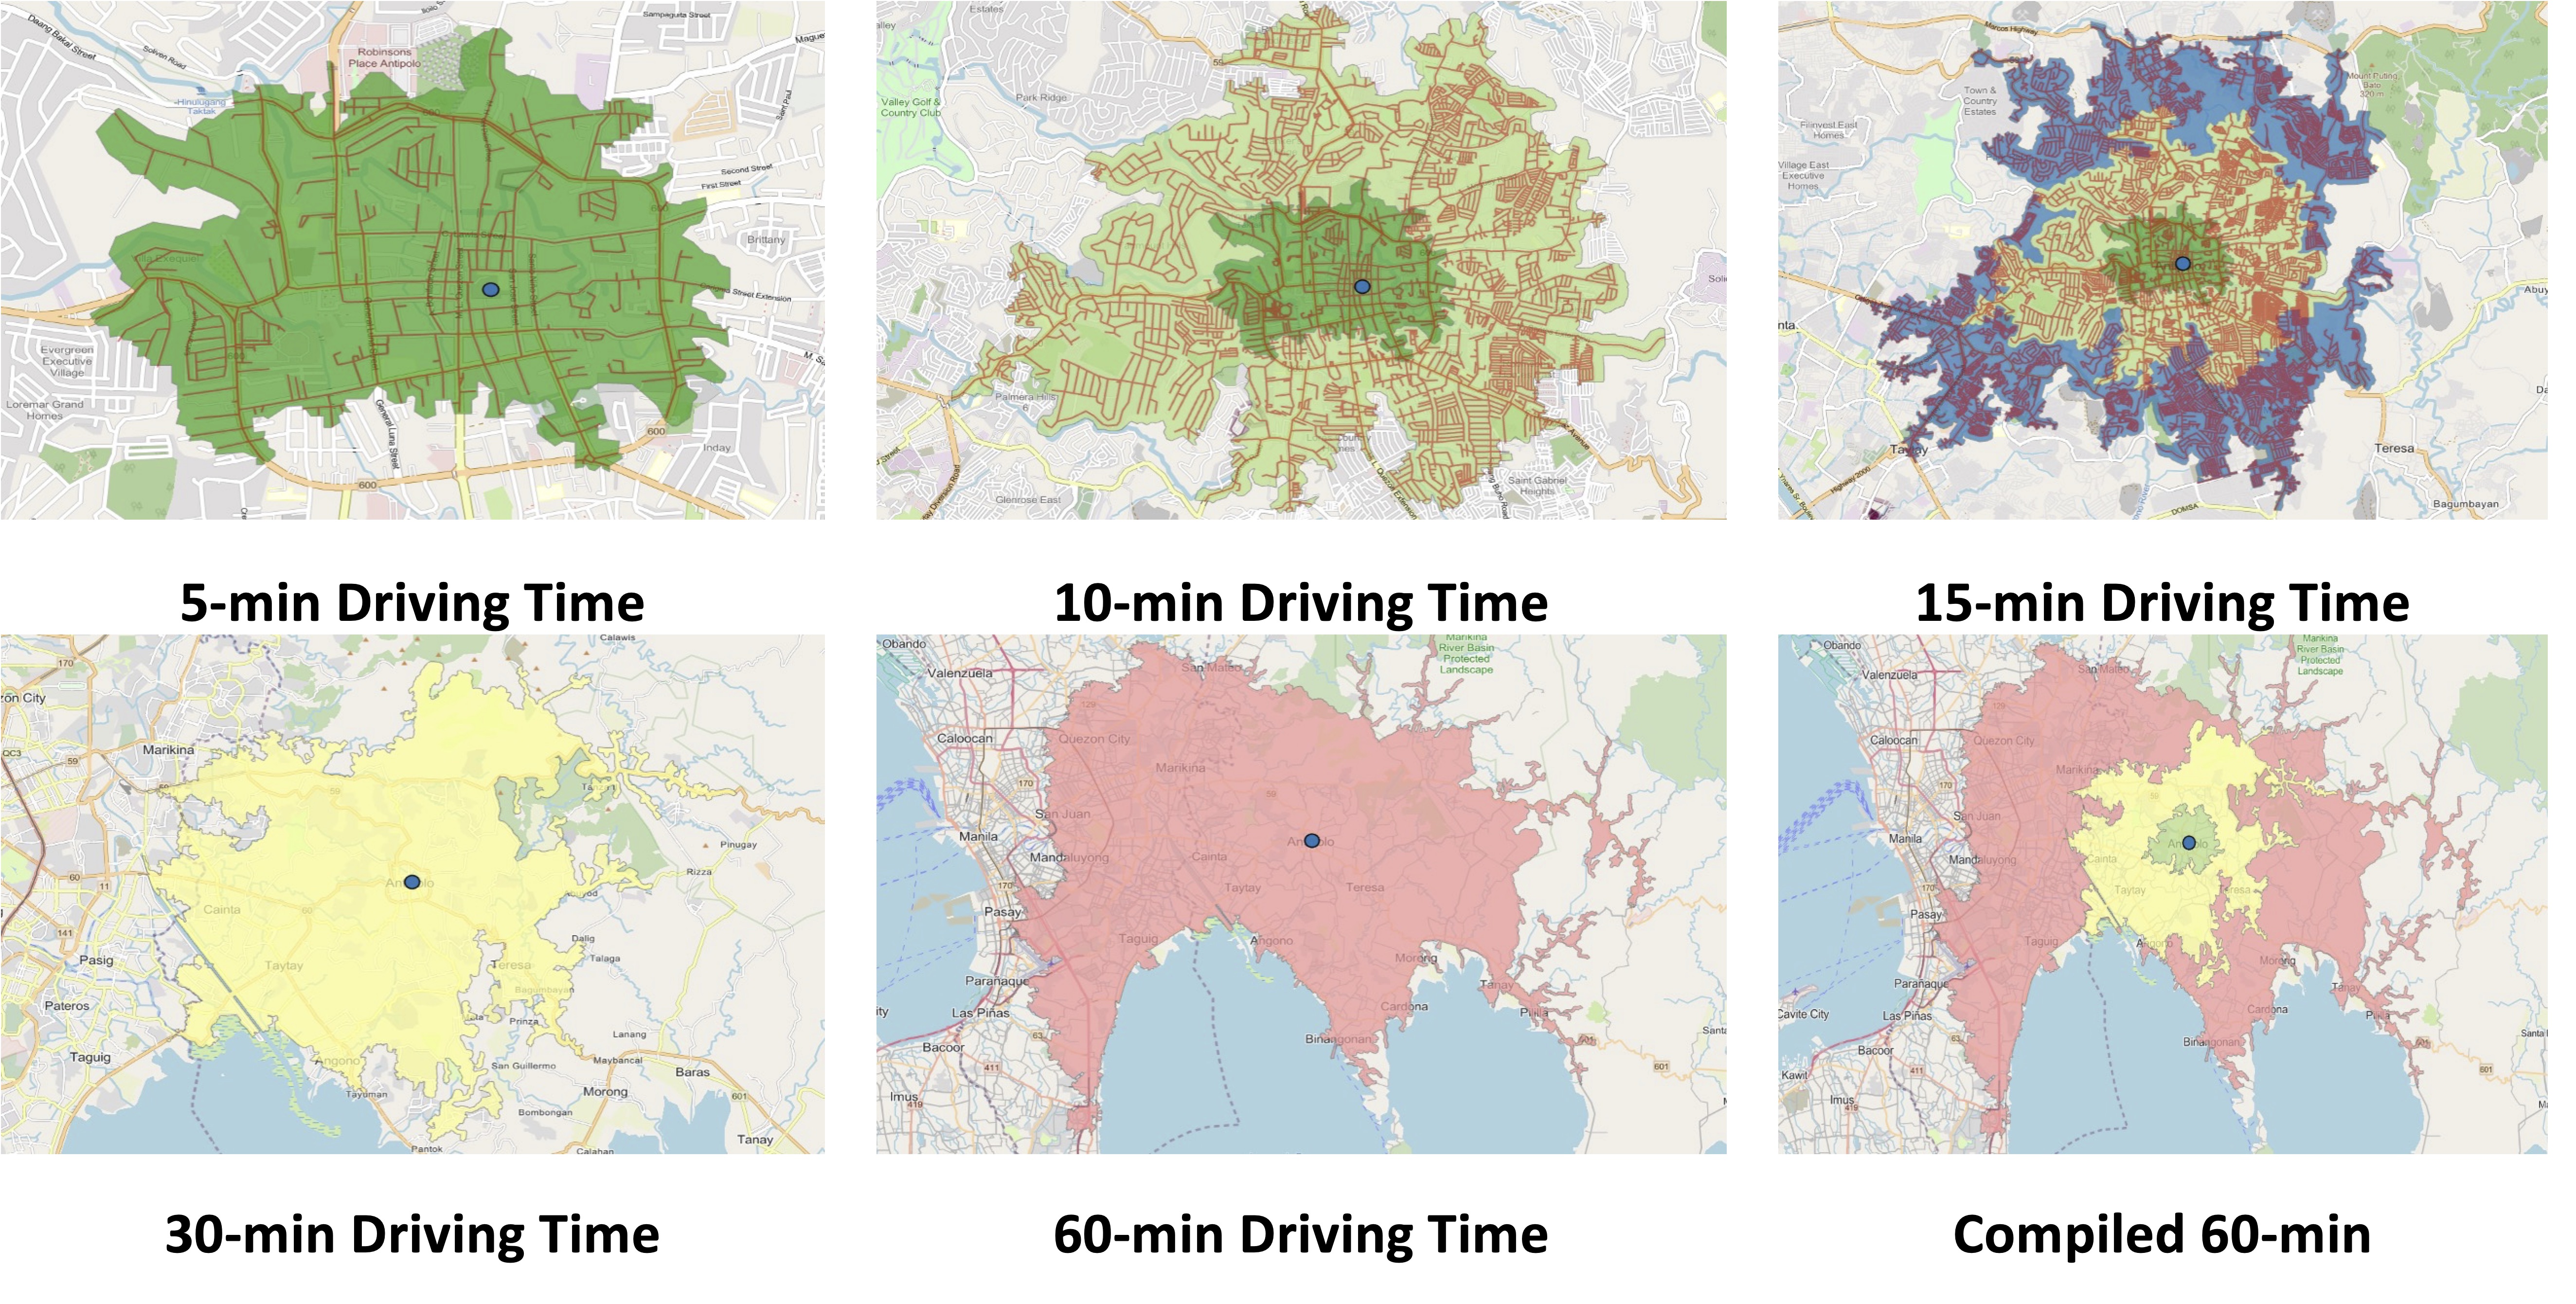
While shown are driving times and assuming car use, similar maps can be produced for public transportation, motorcycles, bicycles and even walking. It is just a matter of collecting the data and plotting them. Alternatively, the data can probably be obtained or derived from sources like Google Traffic or Waze. Some effort, of course, is required in order to have more accurate maps especially considering the road network and traffic circulation. Note that the travel times indicated are also centered on the Antipolo Shrine, which for presentation purposes was used to represent the center of the city. Other maps can be produced in aid of planning travel and transportation for the purposes of the city (e.g., how long it takes between Antipolo and Cubao for a regular commute, etc.).
–
On accountability, good governance and missed opportunities
Yesterday was the death anniversary of former President Benigno “Noynoy” Aquino III whom many fondly called PNoy. His administration saw many fiscal and policy reforms being implemented, resulting in perhaps the best economic performance of the country this century. Of course, they also benefitted from the developments of the previous administration but good sowing cannot result in a good harvest if what was planted was not nurtured to have a good yield in a timely manner. That goes without saying that there were also many low hanging fruits that were not picked for whatever reason the PNoy administration (his people, not necessarily PNoy) had. That included the Cebu BRT project that only recently was partly completed and operational.
Missed opportunities – I always wondered why there were no major infrastructure projects completed during the 6-year term of PNoy. I’m sure someone in the know can refute this but to most people, can we identify a major infra project completed during that time? Were there any new transportation projects like a rail or BRT line completed then? Were there new airports or terminals? Were there tollway projects completed (sections don’t count, we are talking about complete projects)? Any major bridges completed? What were completed mostly were policy and governance related items, particularly those intended to reform a system that was perceived as corrupt and inefficient. It was the same mistake the Cory administration did back in the late 1980s and early 1990s that led to energy and water crisis that the Ramos administration had to address. Of course, that administration had to deal with a lot of political destabilization attempts at the time. That administration had to deal with a lot of projects initiated or in the pipeline by the previous administration, which until now is being regarded as good examples of “what if” for transportation infrastructure. It took a long time, for example, before another mass transit line was constructed in Metro Manila. The reforms now currently being lobbied by various groups could have been done during the PNoy admin but were not. Hopefully, the current administration can catch up given some major players now including the DepDev Secretary were also involved back then.
–
More urban expressways for Metro Manila?
I’ve written about expressways before and particularly about where they probably are most suitable and where they shouldn’t be constructed. Here is the article I posted here in 2021: https://d0ctrine.com/2021/05/03/in-defense-of-expressways/
I will not comment anymore about the alignment of the proposed SALEX but here is a “without” and “with” elevated tollway that’s based on a photo of Padre Faura we took while doing a recon around the PGH compound last Friday.
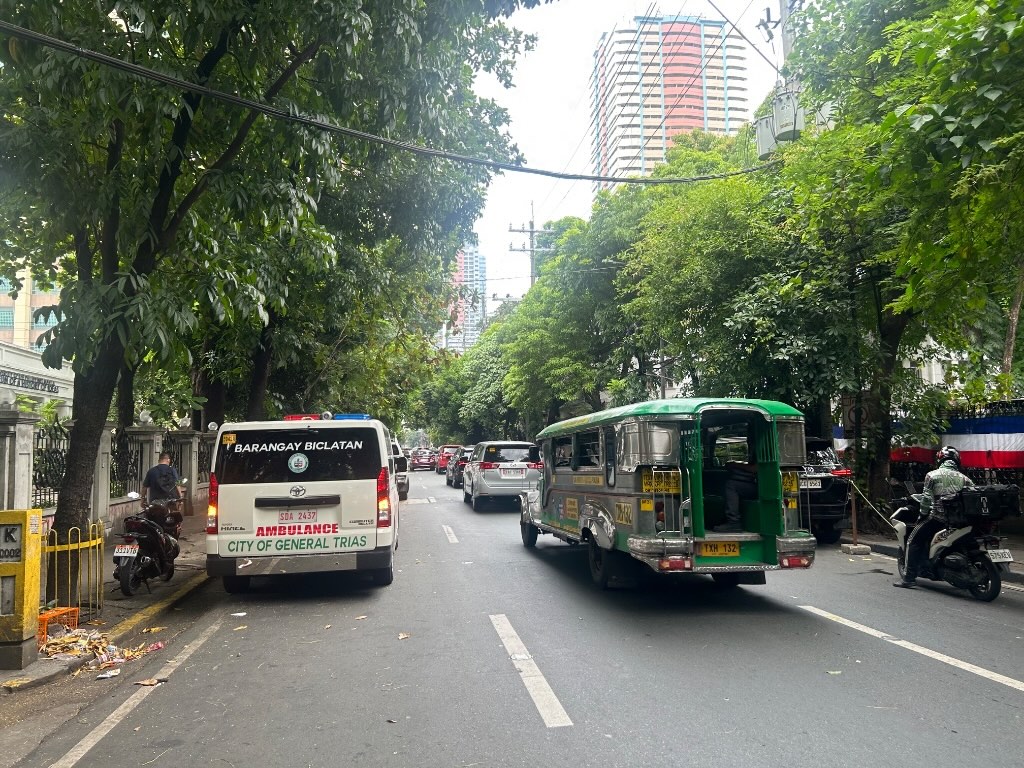 Photo of section of Padre Faura Street fronting U.P. Manila’s Museum of Ideas
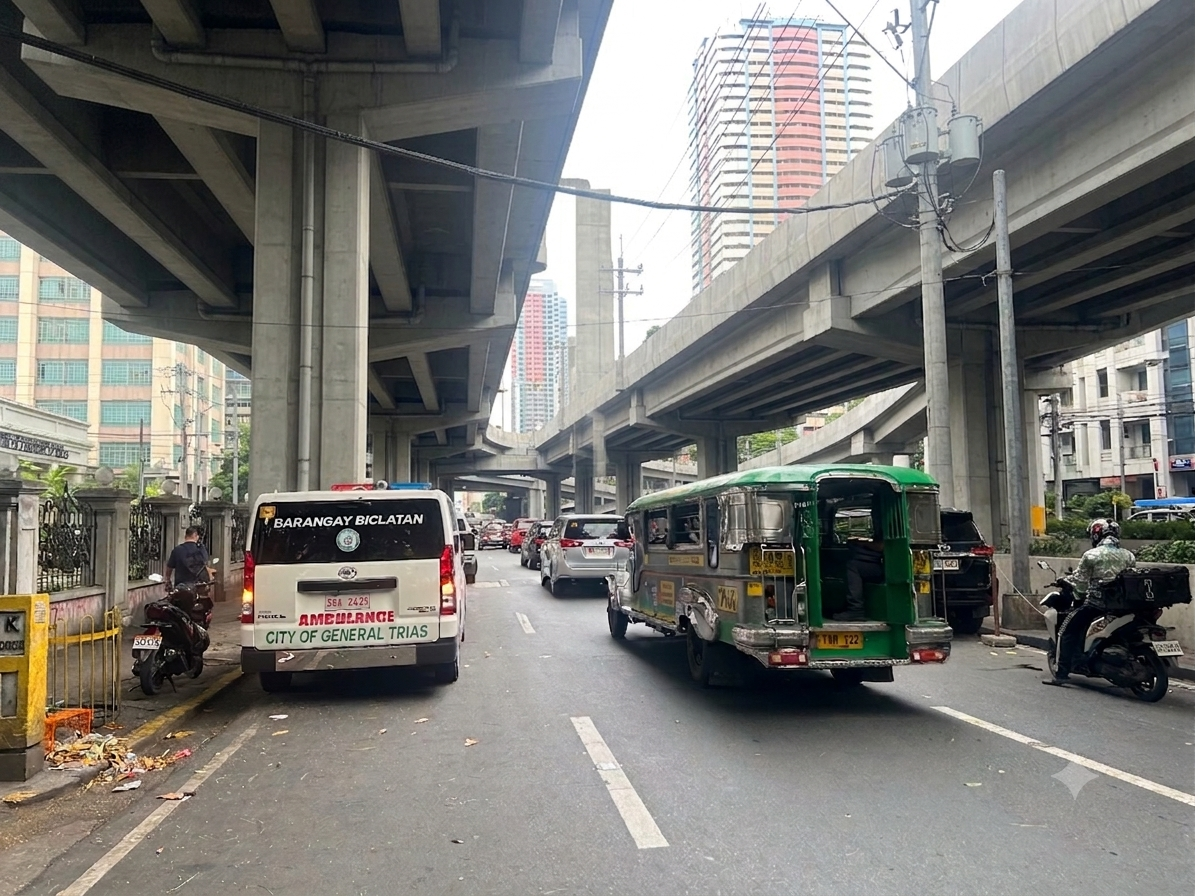 AI-assisted image showing the transformation of the section once the proposes SALEX is constructed. The elevated tollway should be higher than the renders you see on social media because there is the Line 1 along Taft Avenue.
Can the trees be saved? Maybe and by saved we don’t mean that they will be transferred. They should be retained where they are.
Why is San Miguel so intent in constructing these tollways? Is it really to “solve” Metro Manila traffic? Most objective, level-headed experts will tell you that the solution involved public and active transportation rather than more tollways. Who is whispering to Ramong Ang’s ears and advising him to build more of these tollways (and bridges)? Your guess is probably as good as mine…
–
A tollway over Padre Faura?
We had a recon survey of the streets surrounding the UP Manila and UP PGH compound this morning. We walked the entire time and got to see firsthand the conditions along the streets including Pedro Gil and Padre Faura. I’ve seen and read a lot about the proposed SALEX with an alignment that will have the proposed tollway above Padre Faura.
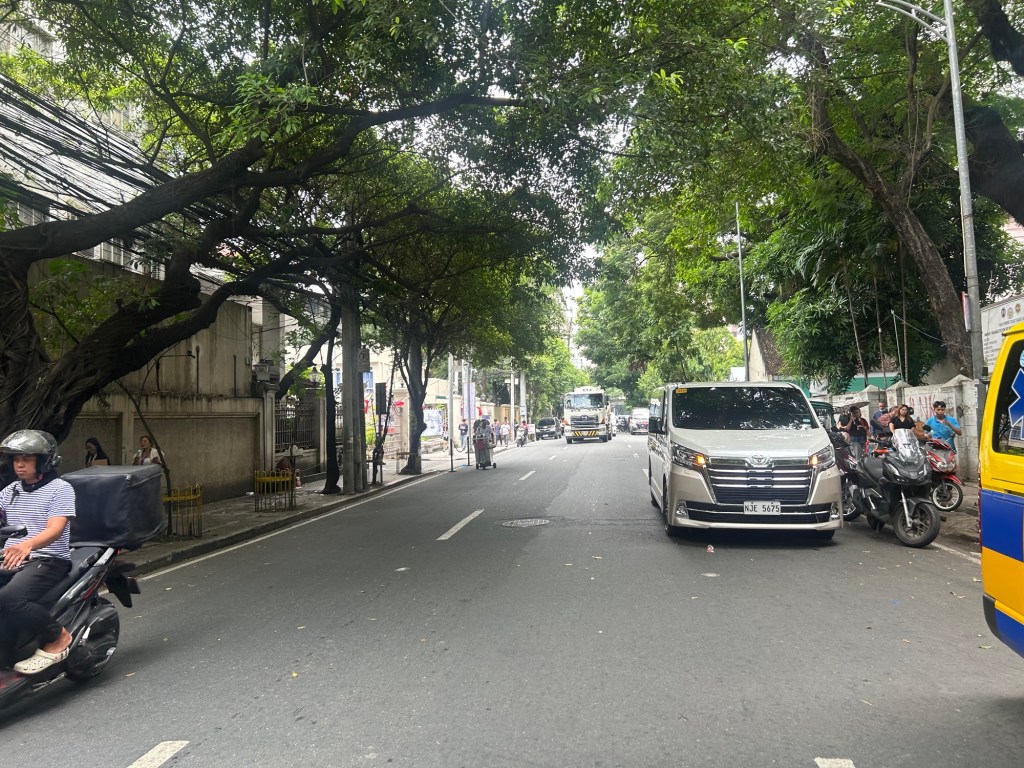
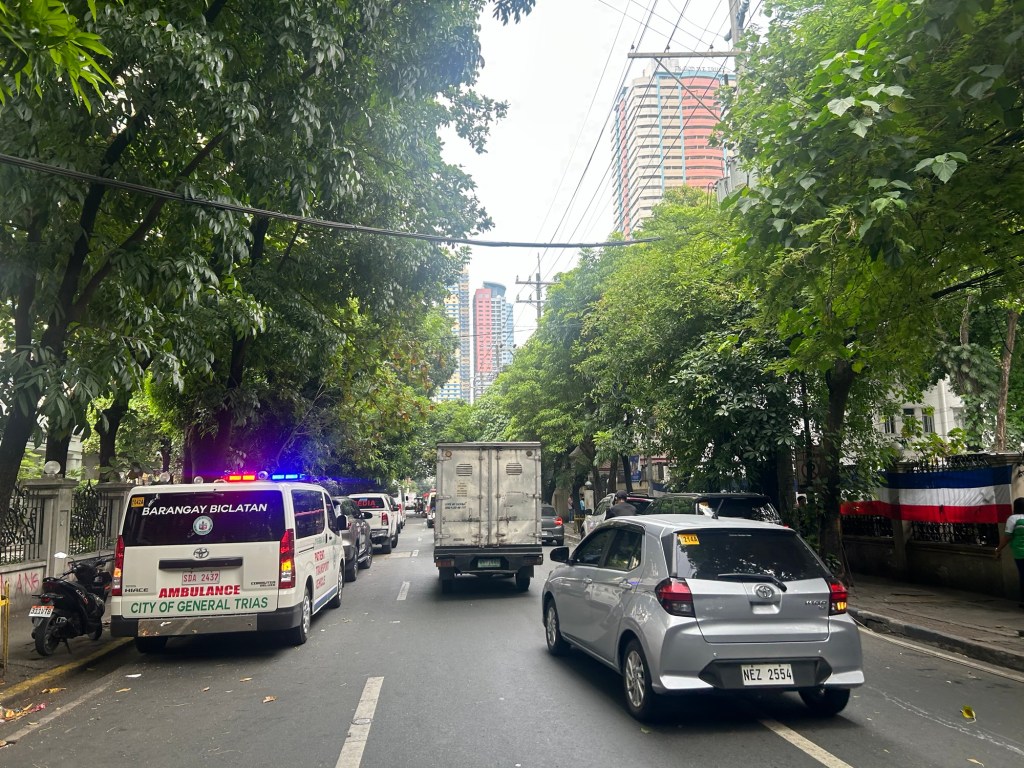
I can’t imagine the blight that the elevated tollways will have on Padre Faura. It will surely affect traffic along the street during construction. There is a lot of AI-generated renders of what it will look like. However, not clearly shown would be the effect of the tollway on a narrow street like Padre Faura. It will be higher than the Line 1 along Taft Avenue though so most renders you see on social media are incorrect in terms of elevation.
Were the establishments along Padre Faura consulted before the alignment of the proposed tollway was submitted for approval? That alone seems to be a glaring flaw in the PPP law considering the location of the tollway. Why is another tollway for construction in the metropolis when what are required are mass transit lines and better public transport?
–
On the reduced traffic due to the energy crisis
The past weeks have seen traffic reduced along my usual routes for my commute between my home and workplace. This could be attributed to the energy crisis as, apparently, many have chosen to plan their trips and use other options other than private/personal transportation for their travels. The reduction in traffic is probably due to reduced numbers of private cars and motorcycles as people cut down on unnecessary trips. Of course, most schools are off at this time of the year so that means a significant number of trips are off the roads (and rails in the case of Metro Manila).
My travel time is only about 60 to 70% of the usual during peak hours. And about half during off-peak. That is a significant reduction in travel time and perhaps translates to not just reduced fuel consumption in general but also reduced emissions as well. On weekends, I also observed that there are less motorcycle traffic to and from Antipolo where I reside. I am referring to the groups who usually have their recreational rides during weekends. Did bicycle traffic increase? My observation is that there seems to be an increase for the weekdays but it’s about the same on weekends. Bicycles, after all, are not affected by the fuel price hikes. Perhaps people who can bike opt for the mode instead of their motorized vehicles? The only way to determine if indeed there were significant mode shift is to do surveys. But for now, careful observation not of traffic but travel times will suffice as proof of the easing of traffic due to the crisis.
–

