
Home » Posts tagged 'data collection'
Tag Archives: data collection
Counting cars: ideal vantage points for intersections and elevated highways
The weekend found us staying at a hotel in Makati in order to be near the recital venue for our daughter. Our room afforded a nice view of the surrounding areas (we were on the 29th floor) but the traffic engineer in me gave in to the temptation to take photos of a major intersection nearby – the Gil Puyat Avenue – Ayala Avenue intersection. These are two of the most prominent streets in the Makati CBD and strategically located at one corner is the Makati City Central Post Office and a stone’s throw away is the Makati City Central Fire Station. At another corner is the RCBC tower that hosts foreign embassies including the offices of the European Union.
 Intersection of Gil Puyat Avenue (formerly Buendia Avenue) and Ayala Avenue
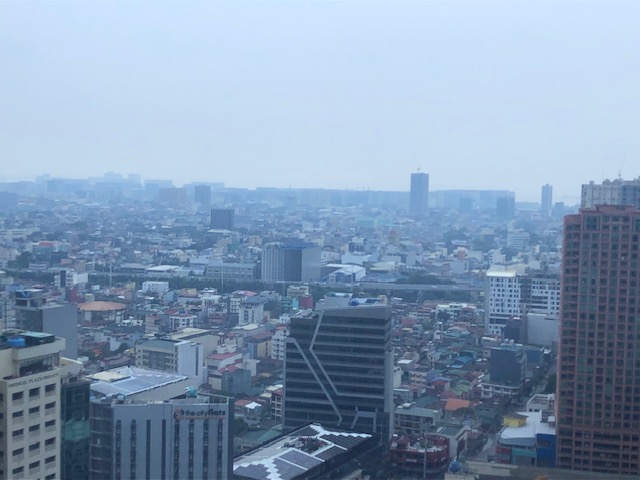 A view of the skyway in the distance
The view of the intersection gave some flashbacks to times when I was a student and a young researcher who had to find good vantage points for collecting traffic data particularly for intersections. Aside from the movements and the corresponding counts, the junction configuration can clearly be seen from the top and useful for developing models for analysis. There was a time when we coveted such views for traffic simulation. You can can install a camera so that you can record hours of footage to use for data extraction. The video recording also allowed one to revisit the footage in case there are questions regarding the data. The same videos can also be used for image processing for more automated, even intelligent or smart data collection using computers.
–
Counting cars…and other vehicles as well
I saw a couple of these counting instruments set-u by the DPWH, one along Ortigas Avenue Extension and another along Sumulong Highway. These are mobile counting machines that are used to count vehicles along both directions of the roads. These are supposed to be calibrated to be able to distinguish among the various types of vehicles using the roads. I assume the classifications would be according to the types used by the DPWH and not simply a general count of the number of vehicles. I wonder though if these can accurately count smaller vehicles like motorcycles, bicycles and PMD’s like the one in the photo below.

If these can be calibrated to count bicycles and PMDs, it would allow for the establishment of baseline numbers and expansion or seasonal factors for what are now termed as micromobility modes. The recent bicycle counts done through volunteers and during peak hours cannot be expanded simply because there are no reference factors that can be used for this purpose. The available expansion or seasonal factors with DPWH derived from 24-hour counts at strategic locations along national roads only account for motor vehicles. These cover the variations of motor vehicle traffic over long periods of time (e.g., 24/7) that allows one to determine Annual Average Daily Traffic (AADT) as well as typical traffic during certain days of a week (e.g., traffic on a Monday or a Sunday).
–
On bike counts – Part 1
Bike counts are being conducted this June and July in many cities around the country to mainly determine the number of cyclists in various locations in the participating cities and if there was an increase in the numbers. An increase will be encouraging and should support the upgrading and expansion of the bike lanes network established during this pandemic (we are not yet in the post-Covid-19 age).
The following Images are from the Mobility Awards Facebook Page where you can find the rationale for these surveys. Vehicle or pedestrian counts are perhaps the most basic type of surveys and are conducted over certain periods of time to establish variability as well as seasonality. In the case of most if not all the counts mentioned below, surveys were and are to be conducted during the perceived peak periods for bike traffic: 6:00 to 8:00 AM and 4:00 to 6:00 PM.


Counts like these need to be evaluated or analyzed considering various contexts. While the outcomes of such counts are often presented from the point of view of advocates and there is a tendency to play with the numbers (which I will explain in more detail in succeeding posts), the bigger picture relating bike numbers to other modes of transport would be among the most important. Trip purpose is another essential factor to be considered. And there is also data on the origin-destination characteristics of trips. Historical or time series data is also important if trends are to be established.
By itself, these bicycle counts are very important data that will ultimately be useful for planning, design and construction of facilities for active transport. The lack of data on bicycles while there is a bias for motor vehicle data means we cannot see the complete picture and therefore remain car-centric when dealing with transportation issues.
–
What if MUCEP was wrong?
I am not a stranger to the perils of bad data and the analysis, conclusions and recommendations based on it. Last week and the next couple, our students will be presenting and defending their research proposals (one group) and research outcomes (another group), respectively. Many of these students conducted secondary data collection and/or depended on online surveys for their primary data needs including interviews for their respective topics. Much of the secondary data are from past studies including the MMUTIS Update and Capacity Enhancement Project (MUCEP), which was the most recent comprehensive transport planning study for what we basically refer to now as NCR Plus (MUCEP covers Mega Manila, which includes parts of Bataan, Pampanga, Batangas and Quezon provinces aside from Bulacan, Cavite, Laguna and Rizal).
I share the following quote from one who is in the know or has inside information about what went about during the data collection for a major project that sought to update the Metro Manila Urban Transportation Integration Study (MMUTIS):
“The MUCEP data can not be trusted. A major part of the survey was done by DoTr (via a contracted group) – not by JICA-supervised surveys. Its results revealed a large portion of walking per day, because the surveyor filled up the forms and/or disregarded sampling design as most car-owning HH were not available (working or declined to participate) during the survey.
However, citing it is for convenience (aura of credibility). Its (mis)use is another matter.”
The stories are not at all new and I have heard this from various sources including surveyors and survey supervisors themselves whom we also engage for our own data collection (it’s a small world after all – transportation practice in the Philippines). Whether these are factual or not, should be obvious from the data and whether it is consistent with past studies or presents an abrupt change in matters such as mode share and vehicle ownership.
Of course both the DOTr and JICA will deny there was any error in data collection at the time and the weights of their statements will definitely make these the more accepted even if there are reasonable doubts about the assumptions and the survey implementation. But infallibility claims aside, what if the assertion in the quote was correct? What are the implications to activities such as forecasting, policymaking or master planning? Are we not surprised or dumbfounded that despite what is being reported as lower vehicle ownership for Mega Manila, it seems that people do have the motor vehicles and are opting to use them as public transport reliability and safety perceptions are still at low points. Mode choice after all is not as simple as some people want to make it appear to be. And if the assumptions including vehicle ownership are off then any modeling or analysis will end up with erroneous results.
–
Dominant trips during the day
I read this post on social media stating:
“The work commute is statistically the longest and least frequent type of journey we make in a day. Yet it dominates transport planning.Now more than ever, cities must build cycle networks to support recurring local trips: to the corner store, café, community center, or school.”
I am not sure about the context of the word “dominate” as it is used in the statement but this originates from the Dutch so perhaps there is a difference, even slight, between their case and ours. I would like to add though that aside from “going home” trips, the most dominant in the Philippine context are “to work” and “to school”. And dominant here covers frequency and distance traveled. Consequential are travel times as these are affected by the quantity and quality of facilities and services available to commuters.
I think there should also be restructuring of how surveys are conducted to capture these more frequent trips. Typical surveys like JICA’s usually ask only about the main trips during the day so those will have responses of “to work”, “to school” or “to home”. For the metro level, maybe that’s okay but at the local levels, LGUs would have to make their own surveys in order for data to support initiatives for local transport, most especially active transport. A possible starting point would be the trip chains collected that appear to be a single trips with “original origins” and “final destinations”. These can be separated or disaggregated into individual trips made by different modes rather than be defined or associated with a single (main) mode of transport. That surely would expand the data set and redefine the mode shares usually reported.
–
