
Home » Posts tagged 'data'
Tag Archives: data
Article share: On the busiest shipping routes
Here is an article on maritime transportation. I don’t get to feature similar topics here as mostly I have written about land and air transport. I thought this article is interesting because it describes maritime transport traffic volume. Statistics like these appear to be trivial but are important especially from the perspective of logistics as well as, if you delve in to it, maritime security.
Piper, G. (July 11, 2023) “The busiest shipping routes in the world by the numbers,” Medium, https://grantpiperwriting.medium.com/the-busiest-shipping-routes-in-the-world-by-the-numbers-c09571ad5af6 [Last accessed: 8/2/2023]
To quote from the article:
“The vast majority of world trade sees Asia as the focal point. Both Europe and North America do heavy volumes of trade with Asia, mostly imports. But three of the five busiest shipping routes in the world are all internal routes. Europe-Europe, North America-North America, and Asia-Asia. That means that vast amounts of global trade are still relatively local.
Large importers like the United States and England drive massive amounts of trade. Large exporters, like China, Korea, and Japan, also drive massive amounts of trade. The areas where these terminuses link up are the busiest hotspots for global trade.”
A while back in 2004-2005, I was involved in an inter-regional passenger and freight flow study in the Philippines. We gathered data on maritime transport and were able to derive the OD tables for inter-regional and inter-island passenger and freight flow. Unfortunately, those studies and surveys had no follow-up or updating afterwards. There is a saying that “you can’t manage what you can’t measure.” This applies to transport as well so perhaps there are data somewhere and someone’s using them. We hope government agencies are able to collect the data required to analyze and improve maritime transport in the country.
–
On bike counts – Part 1
Bike counts are being conducted this June and July in many cities around the country to mainly determine the number of cyclists in various locations in the participating cities and if there was an increase in the numbers. An increase will be encouraging and should support the upgrading and expansion of the bike lanes network established during this pandemic (we are not yet in the post-Covid-19 age).
The following Images are from the Mobility Awards Facebook Page where you can find the rationale for these surveys. Vehicle or pedestrian counts are perhaps the most basic type of surveys and are conducted over certain periods of time to establish variability as well as seasonality. In the case of most if not all the counts mentioned below, surveys were and are to be conducted during the perceived peak periods for bike traffic: 6:00 to 8:00 AM and 4:00 to 6:00 PM.


Counts like these need to be evaluated or analyzed considering various contexts. While the outcomes of such counts are often presented from the point of view of advocates and there is a tendency to play with the numbers (which I will explain in more detail in succeeding posts), the bigger picture relating bike numbers to other modes of transport would be among the most important. Trip purpose is another essential factor to be considered. And there is also data on the origin-destination characteristics of trips. Historical or time series data is also important if trends are to be established.
By itself, these bicycle counts are very important data that will ultimately be useful for planning, design and construction of facilities for active transport. The lack of data on bicycles while there is a bias for motor vehicle data means we cannot see the complete picture and therefore remain car-centric when dealing with transportation issues.
–
What if MUCEP was wrong?
I am not a stranger to the perils of bad data and the analysis, conclusions and recommendations based on it. Last week and the next couple, our students will be presenting and defending their research proposals (one group) and research outcomes (another group), respectively. Many of these students conducted secondary data collection and/or depended on online surveys for their primary data needs including interviews for their respective topics. Much of the secondary data are from past studies including the MMUTIS Update and Capacity Enhancement Project (MUCEP), which was the most recent comprehensive transport planning study for what we basically refer to now as NCR Plus (MUCEP covers Mega Manila, which includes parts of Bataan, Pampanga, Batangas and Quezon provinces aside from Bulacan, Cavite, Laguna and Rizal).
I share the following quote from one who is in the know or has inside information about what went about during the data collection for a major project that sought to update the Metro Manila Urban Transportation Integration Study (MMUTIS):
“The MUCEP data can not be trusted. A major part of the survey was done by DoTr (via a contracted group) – not by JICA-supervised surveys. Its results revealed a large portion of walking per day, because the surveyor filled up the forms and/or disregarded sampling design as most car-owning HH were not available (working or declined to participate) during the survey.
However, citing it is for convenience (aura of credibility). Its (mis)use is another matter.”
The stories are not at all new and I have heard this from various sources including surveyors and survey supervisors themselves whom we also engage for our own data collection (it’s a small world after all – transportation practice in the Philippines). Whether these are factual or not, should be obvious from the data and whether it is consistent with past studies or presents an abrupt change in matters such as mode share and vehicle ownership.
Of course both the DOTr and JICA will deny there was any error in data collection at the time and the weights of their statements will definitely make these the more accepted even if there are reasonable doubts about the assumptions and the survey implementation. But infallibility claims aside, what if the assertion in the quote was correct? What are the implications to activities such as forecasting, policymaking or master planning? Are we not surprised or dumbfounded that despite what is being reported as lower vehicle ownership for Mega Manila, it seems that people do have the motor vehicles and are opting to use them as public transport reliability and safety perceptions are still at low points. Mode choice after all is not as simple as some people want to make it appear to be. And if the assumptions including vehicle ownership are off then any modeling or analysis will end up with erroneous results.
–
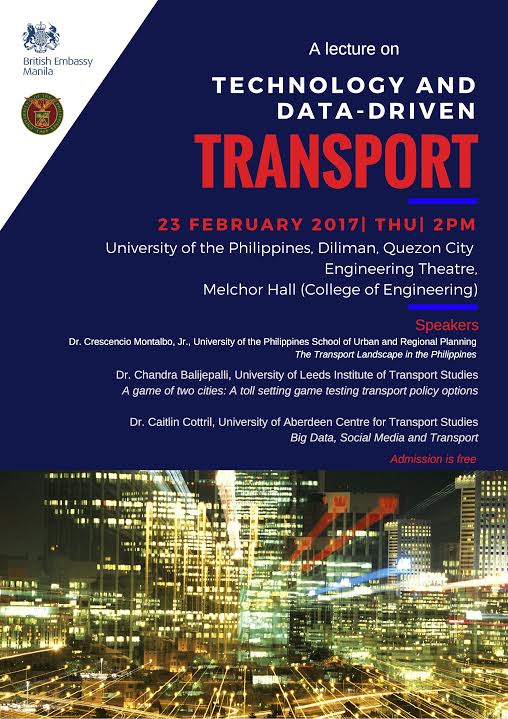
Special lectures on transport – February 23, 2017
I just wanted to share the following announcement from the University of the Philippines Diliman about special lectures on transport. The lectures will be delivered at the Melchor Hall theater at the UP Diliman campus and is open to the public.
–
Working with big data on transportation
There have been a few initiatives working on big data from government agencies whose responsibilities are primarily on transportation. Among them are past projects implemented by the University of the Philippines Diliman (UPD) and current projects being implemented by UPD, Ateneo de Manila University (ADMU) and De La Salle University (DLSU) with support from the Department of Science and Technology (DOST). While these projects are more oriented towards some specific objectives often linked to research & development (mandates of DOST and these academic institutions), there are still a lot of data out there that needs to be digitized, processed and analyzed. UPD has done this to some extent through its National Center for Transportation Studies (NCTS), which had been a repository for data and reports from DOTC and DPWH. However, the center does not have a funded program to undertake that repository or archival function it is expected to do. Despite much lip service from DOTC, DPWH and NEDA, no support has been extend by these agencies in the past many years.
I recently came upon this excellent work from a private firm specializing in data science. Here’s a link to one of their recent ‘stories’ showing us relevant statistics on road safety in Metro Manila:
http://stories.thinkingmachin.es/road-danger-pedestrians/
Their website says the data set the stats and graphs are based from are from the Metropolitan Manila Development Authority (MMDA), which maintains the Metro Manila Accident Reporting and Analysis System (MMARAS). This is good work and something road safety experts can use to be able to come up with programs and projects to improve safety in Metro Manila. I hope they could also get a hand of the DPWH’s Traffic Accident Reporting and Analysis System (TARAS) data that covers national roads. Unfortunately, the DPWH has stopped encoding TARAS data recently (the PNP still collects data though) so I am not sure how recent their data set is.
We need more of such work on a lot of data our agencies are producing including data from the Land Transportation Office (LTO) and the Land Transportation Franchising and Regulatory Board (LTFRB). Such information could be used to understand our transport systems including determining how to optimise supply and demand when combined with other data sets such as geographical information systems (GIS) and socio-economic data from the census.
–
The numbers that matter – some thoughts on data
Too often we are bombarded with statistics, numbers that are supposed to describe the state of things. This is especially true in transportation and traffic where there seems to be a lot of information or data circulating about all kinds of stuff usually including numbers of vehicles, speeds, quantities of people and goods transported, and so on.
There is a tremendous amount of data collected by many government agencies. These include traffic counts by the DPWH, port and airport statistics by the PPA and CAAP, and socio-economic data from all over the country by the NSO. There is also wealth of information that can be derived from various project reports whether these be infrastructure master plans or evaluations of policies and programs related to transport and traffic. Local governments that require transport impact studies for developments within their jurisdictions are supposed to compile the data contained in these reports, which include traffic counts and projections at roads and intersections, transport facilities inventories, and travel time and delay data among others essential for impact analysis.
Origin-Destination (OD) data are important for planning transport from the national to local levels. Inter-regional, inter-provincial or inter-city OD data for people and freight are essential for planning infrastructure that would be able to adequately and efficiently handle the traffic between regions, provinces and cities/municipalities. As it is impractical (i.e., costly) to determine the exact numbers of traffic for all modes on a very frequent basis, sampling is very important and the determination of sample size as well as the sectors and areas to be sampled are essential aspects of any study. The current MMUTIS Update and Capacity Enhancement Project (MUCEP) that is the long-delayed follow-up to the Metro Manila Urban Transportation Integration Study (MMUTIS), for example, required household information surveys (HIS) for an area that is now referred to as Mega Manila, which is basically comprised of Metro Manila, Region 3 and Region 4A. Such a large study area necessitates careful sampling in order for assumptions regarding the data aggregation and disaggregation to hold.
Often, for many studies concerning cities and regions, person trip and freight volume data are more valuable than vehicle trip data. Though vehicle volumes are important, the number of people traveling or the amount of goods being transported are a better basis for planning transport. This is especially true for passengers as it is desirable to have the numbers as the basis for determining the frequencies (how often and with what schedule) and capacities (vehicle size/passenger capacity), which need to be balanced or optimized according to the demand. This demand is variable throughout the year and the day and will definitely have implications on revenues. There are desirable schedules for passengers as well as for goods. Moreover, it is important to determine also the trip distances that would allow for the estimation of the number of trips in terms of passenger-km and ton-km units. Such information are useful for travel demand modeling and forecasting including the evaluation of suitable transport modes and service characteristics for passengers and freight.
[to be continued]
–
Christmas season traffic jams
Traffic jams are a common occurrence in most cities. In some they are predictable, usually during peak hours in the morning and the afternoon or evening. These peak periods may range from less than an hour or stretch to a couple or even longer hours depending on the characteristics of the area. In many cases, congested are main corridors (Commonwealth, Ortigas, Marcos Highway, McArthur Highway, SLEX, etc.) leading to or from the city center or central business district (e.g., Makati, Ortigas, Cubao, etc.). In Metro Manila, it can be a corridor connecting CBDs like EDSA or C-5.
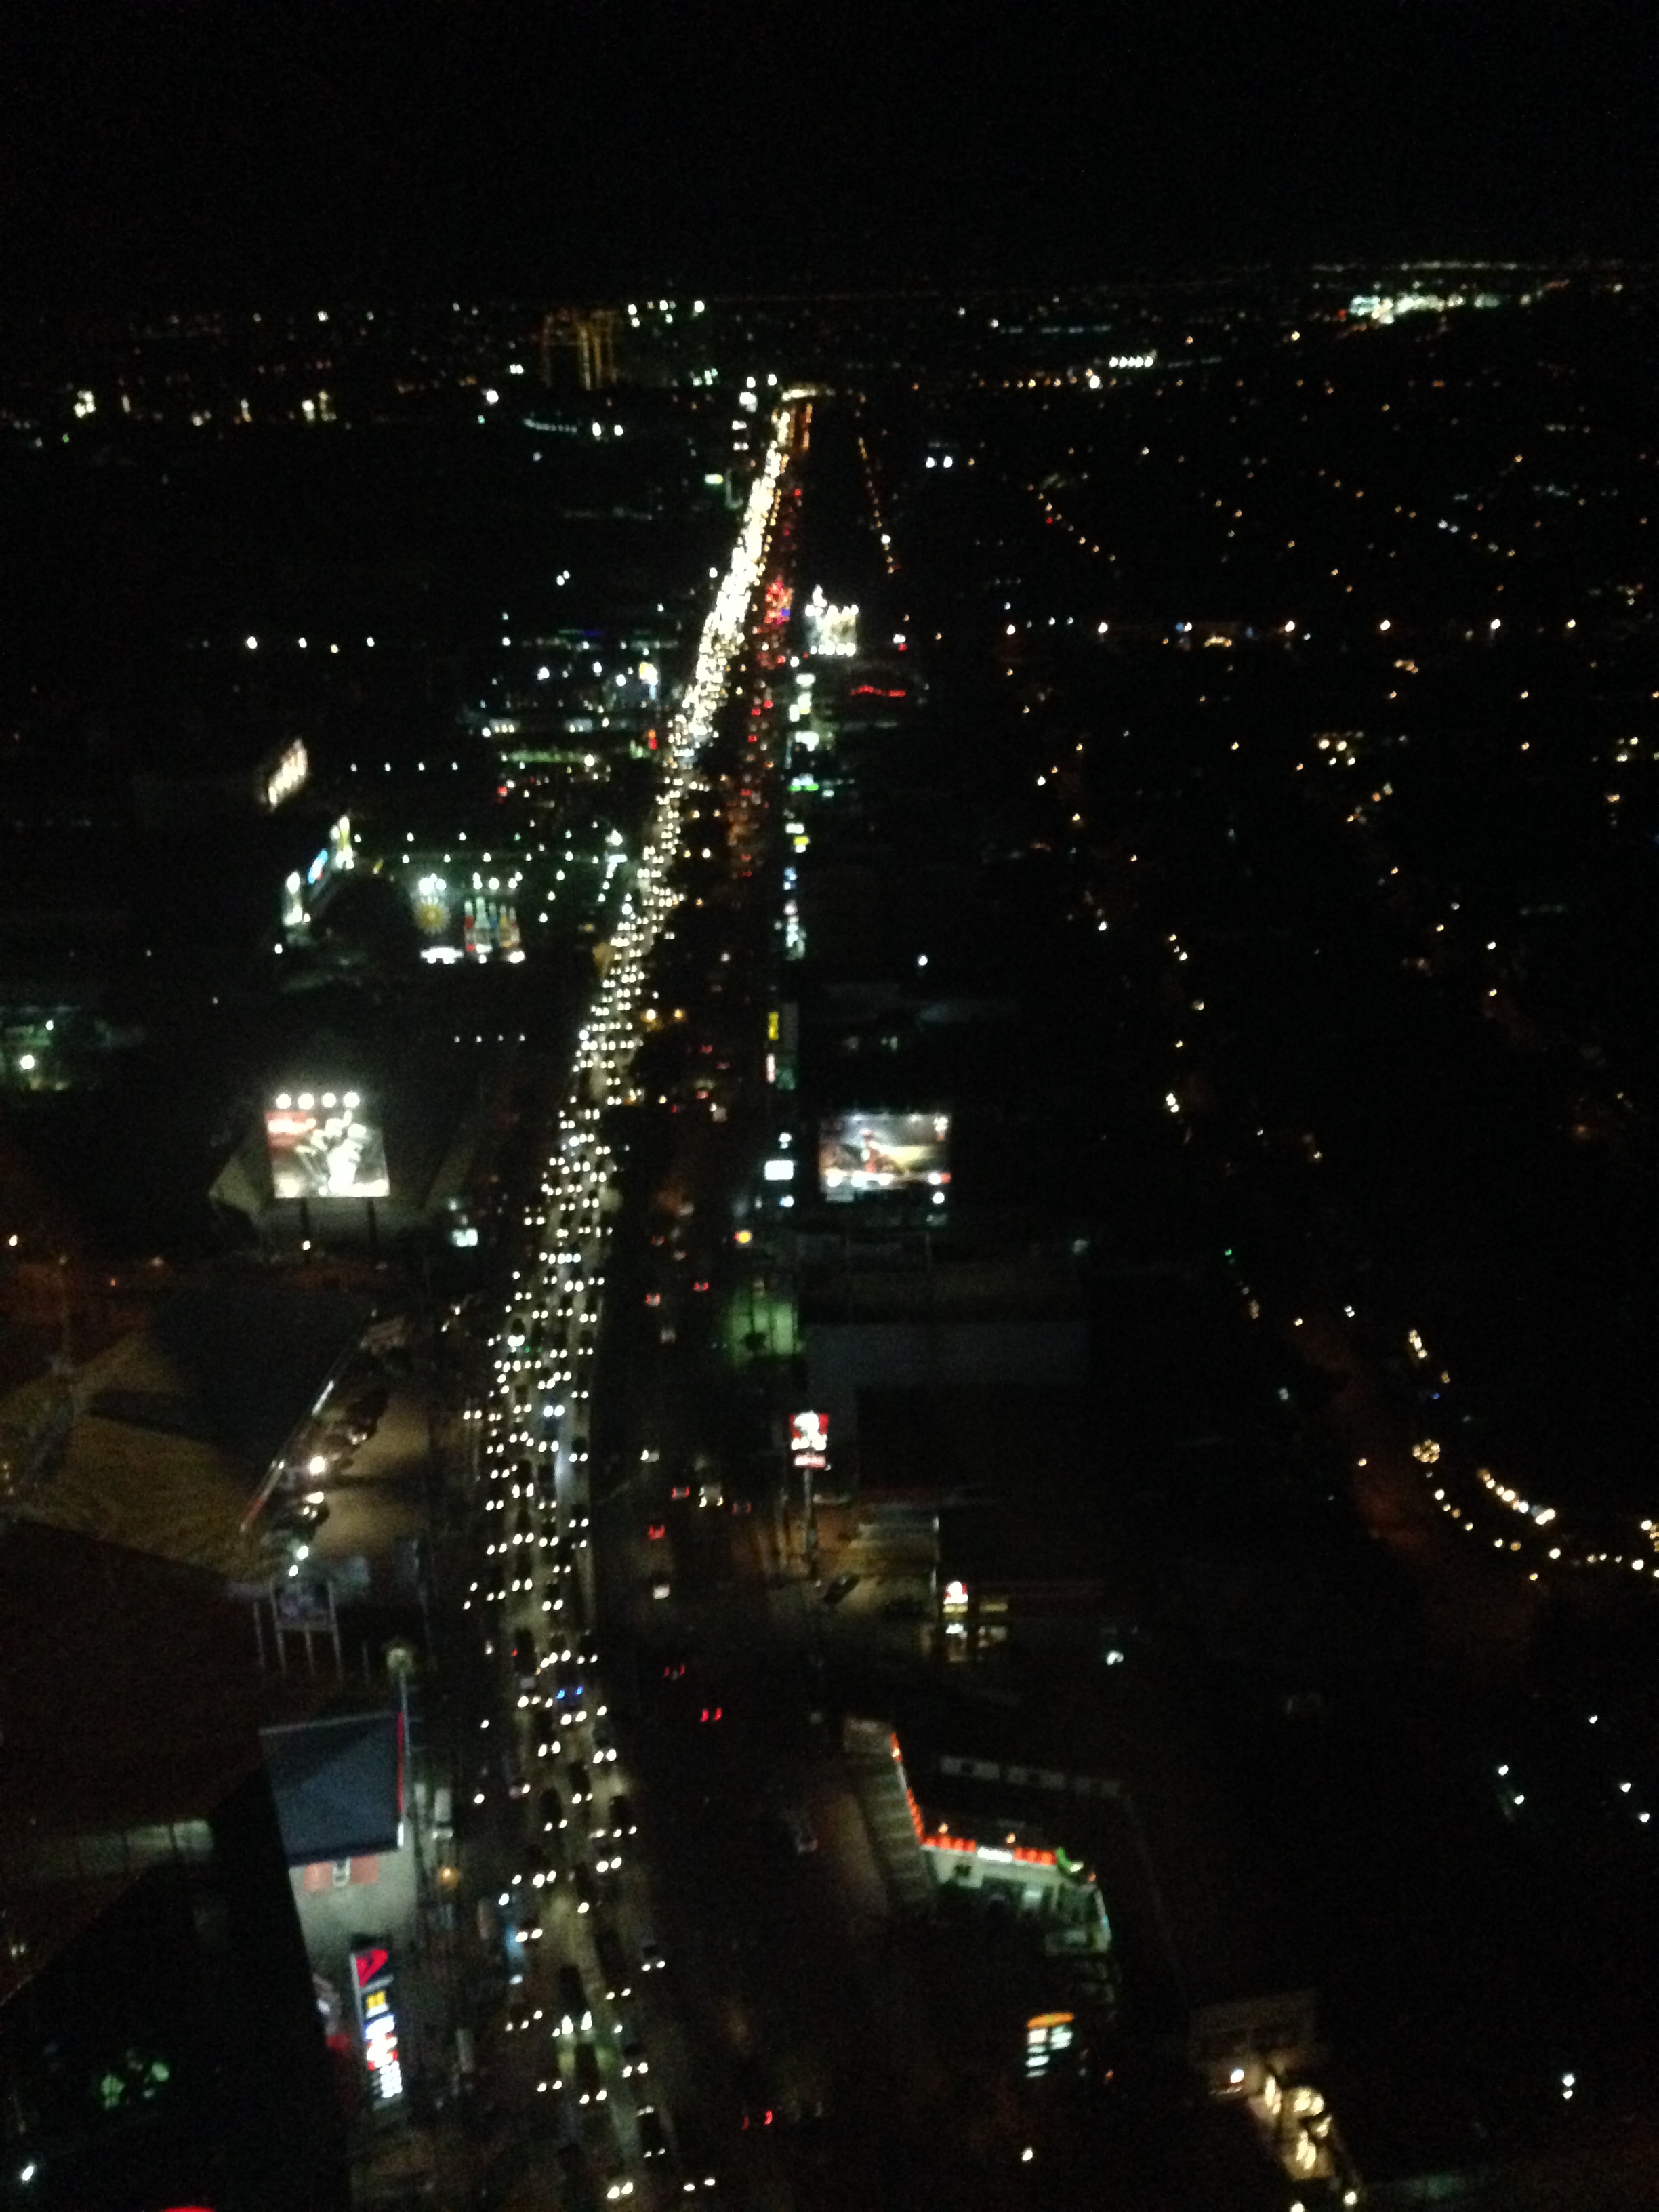 Traffic congestion along the northbound side of Circumferential Road 5 seems much worse this December though it is always bad from the late afternoon to late night on weekdays. Congestion is usually worst along the stretch between Bonifacio Global City and Pasig River though it is also usually bad along the stretch from Ortigas Ave. to Eastwood in Quezon City. Traffic along the southbound side is usually bad in the mornings especially in the Pasig area.
 Traffic congestion along Tramo on the way to the airport – traffic can really be bad in the vicinity of airports during this season but then the way the terminals of NAIA are situated and the conditions along airport roads also contribute to the congestion. For example, along Tramo in Pasay City you will find a lot of bus terminals and informal settlements. There are tricycles and pedicabs operating in the area, and parked vehicles along the road that reduce capacity. I always wonder what local authorities are doing to address these issues considering NAIA is our prime gateway to the world.
Unfortunately, the Christmas season in the Philippines is perhaps the longest in the world so Christmas traffic starts to build up in September (the first of the ‘ber’ months). Worst are days in December when everyone seems to be at their busiest. Aside from the work being done due to deadlines at the end of the year, there are shopping mall sales and Christmas parties.
So how do we know if December is indeed the busiest month of the year in terms of traffic? What evidence can we show as proof to this long-standing perception that is accepted as fact by many? I was asked these questions in a recent interview but unfortunately, I didn’t have the figures to show that December indeed is the busiest month in terms of traffic. Unfortunately, too, our government agencies do not conduct data collection to determine traffic volumes throughout the year so what you can get from the DPWH is Annual Average Daily Traffic (AADT). Perhaps the evidence is with our toll operators, which conduct daily counts through their detectors and their toll booths. The cumulative volume of vehicles per month can be derived from data on tolls collected to validate the notion that December is highest in terms of traffic volumes.
Meanwhile, there might also be video evidence from the cameras installed by the MMDA and other local governments monitoring traffic. Footage taken from January to December can be compared to show which months are the busiest. Taking this to another level, image processing software for traffic are now available or can be developed to determine vehicle volumes from video.
It is reasonable to argue that indeed December is the busiest and we experience more traffic congestion during this month as there are more activities, especially those related to shopping, during this month. Ask anyone on the street and surely they will say that traffic and commuting is worst this time of year but many will also say they aren’t really complaining given the situation of other people (e.g., those affected by the earthquakes in Bohol and Cebu, and those affected by Typhoon Yolanda/Haiyan in the Visayas). For many, this is still a season for joy and we generally don’t let traffic get in the way of happiness.
Merry Christmas to all!
–
