
COVID-19 Infection Risk Assessment of Transport Modes
I posted about the work we have been doing to assess the infection risk (i.e., spread of COVID-19) for various modes of transport considering the transition of many areas including the National Capital Region (NCR) to the General Community Quarantine (GCQ). The work was undertaken through the Transportation Science Society of the Philippines (TSSP), which is under the umbrella of the Eastern Asia Society for Transportation Studies (EASTS). Here is the outcome in the form of an “Infection Risk Classification of Transport Modes or Vehicle Types” developed by a core group of public transportation and road safety specialists among its members:
![]()
![]()
![]()
![]()
Note again that this is the product of a rapid assessment using the mentioned criteria and factors. It is a qualitative assessment and a quantitative one, given the data, would obviously been preferred. Moreover, this is an assessment for risk of infection rather than for road safety. In the “old normal”, for example, cycling and motorcycle use may have a higher risk in traffic given traffic mix, human behavior and lack of facilities to make these modes safe.
–
Assessing the risk of infection from the transport safety perspective
My colleagues and I have been developing a risk assessment table for land transport modes to be submitted to the UP COVID-19 Response Team. We did a rapid assessment using mainly concepts from road safety.
The concepts are fairly simple. Risk assessment can be based on the likelihood of contracting the virus gauged from certain exposure factors. Exposure estimation may be quantitative where metrics are applied and data collected for the analysis. Estimation may alternatively qualitative based on experiences, perceptions, expert opinions, etc. but subject to logic (e.g., careful deduction). In road safety, for example, these factors may be defined as three: time, distance and volume.
Time exposure can be determined using travel time as a metric. Longer the travel times mean higher exposures for a commuter. Higher exposure translate to a higher likelihood that a person may become involved in a road crash. Thus, a commuter traveling for 1 hour, one way, will have a higher likelihood of being involved in a crash compared to another traveling only 10 minutes even assuming that both use the same mode of transport. Applied to the risk of viral infection, longer commutes may mean people can have higher exposure to potential carriers of the virus.
Distance exposure can be determined using travel distance as a metric. Longer travel distances mean higher exposures for a commuter. Higher exposure again translate to a higher likelihood that a person may become involved in a road crash. Thus, a commuter with a travel distance of 10 kilometers will have a higher likelihood of being involved in a crash compared to someone traveling only 1 kilometer. Applying this to the risk of viral infection is similar to the previous case for time exposure even when assuming the same mode of transport.
Volume exposure can be determined using both the volume of vehicles as well as the number of passengers inside the vehicles. The more vehicles or people you have on the roads interacting, the higher the likelihood of one becoming involved in a crash. It can also be argued that riding public transport in high volume, mixed traffic makes a passenger have a higher likelihood of being involved in a crash. Again, applying this to the risk of viral infection, it should be easy to understand why physical distancing is necessary in vehicles as well as outdoors when walking or cycling. It should also extend to having less vehicles on the road to further reduce the likelihood of spreading the virus.
In the real world, we cannot isolate each factor from one another. Instead, we have to contend with all three combining to create various scenarios. Along expressways, for example, the volume of vehicles might be high and so are distances. Time exposure can be lower due to high speeds. Yet high speeds can contribute to increased likelihood of crashes. Meanwhile, traffic congestion has all the ingredients for maximizing the likelihood for crashes and, by extension, viral infection. Long commutes (by time and distance) plus high volumes of people and vehicles combine to create the worst case scenario from the perspectives of both road safety and infection, which are both public health issues.
Next – Why we should not return to the old normal…
–
On the COVID-19 pandemic’s impacts on urban planning
Here is another timely article on the effects of COVID-19 on urban planning. Past pandemics have influenced the way cities are designed and COVID-19 is no different as we are now learning a lot of lessons on how towns and cities need to be laid out or structured to prevent future outbreaks from spreading so quickly while also allowing for a more effective actions in response to infections.
van den Berg, R. (2020) “How Will COVID-19 Affect Urban Planning?”, The City Fix, https://thecityfix.com/blog/will-covid-19-affect-urban-planning-rogier-van-den-berg/ [Last accessed: 5/15/2020]
–
On urban planning resources or references for the pandemic
I am posting for reference this article compiling helpful references for urban planning in the context of the COVID-19 pandemic. Most of the references listed are based on the US experience and I am sure there is already a wealth of information coming from other countries as well including those that have been successful in mitigating the effects of the pandemic.
Brasuell, J. (2020) “Urban Planning Resources for COVID-19”, Planetizen, https://www.planetizen.com/node/109238?utm_source=newswire&utm_medium=email&utm_campaign=news-05142020&mc_cid=2e155996b6&mc_eid=9ccfe464b1 [Last accessed: 5/16/2020]
–
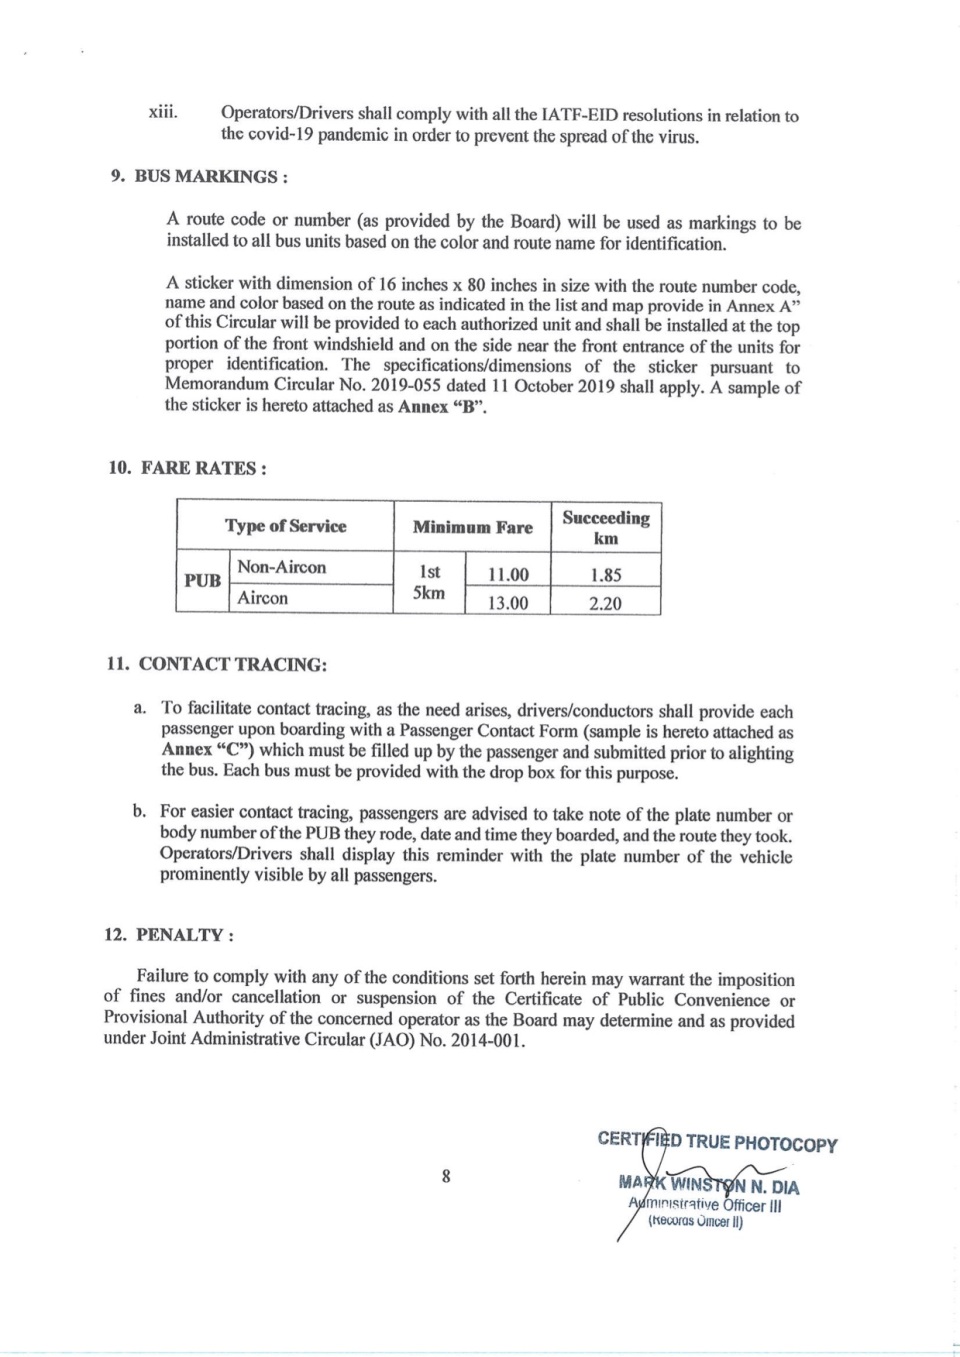
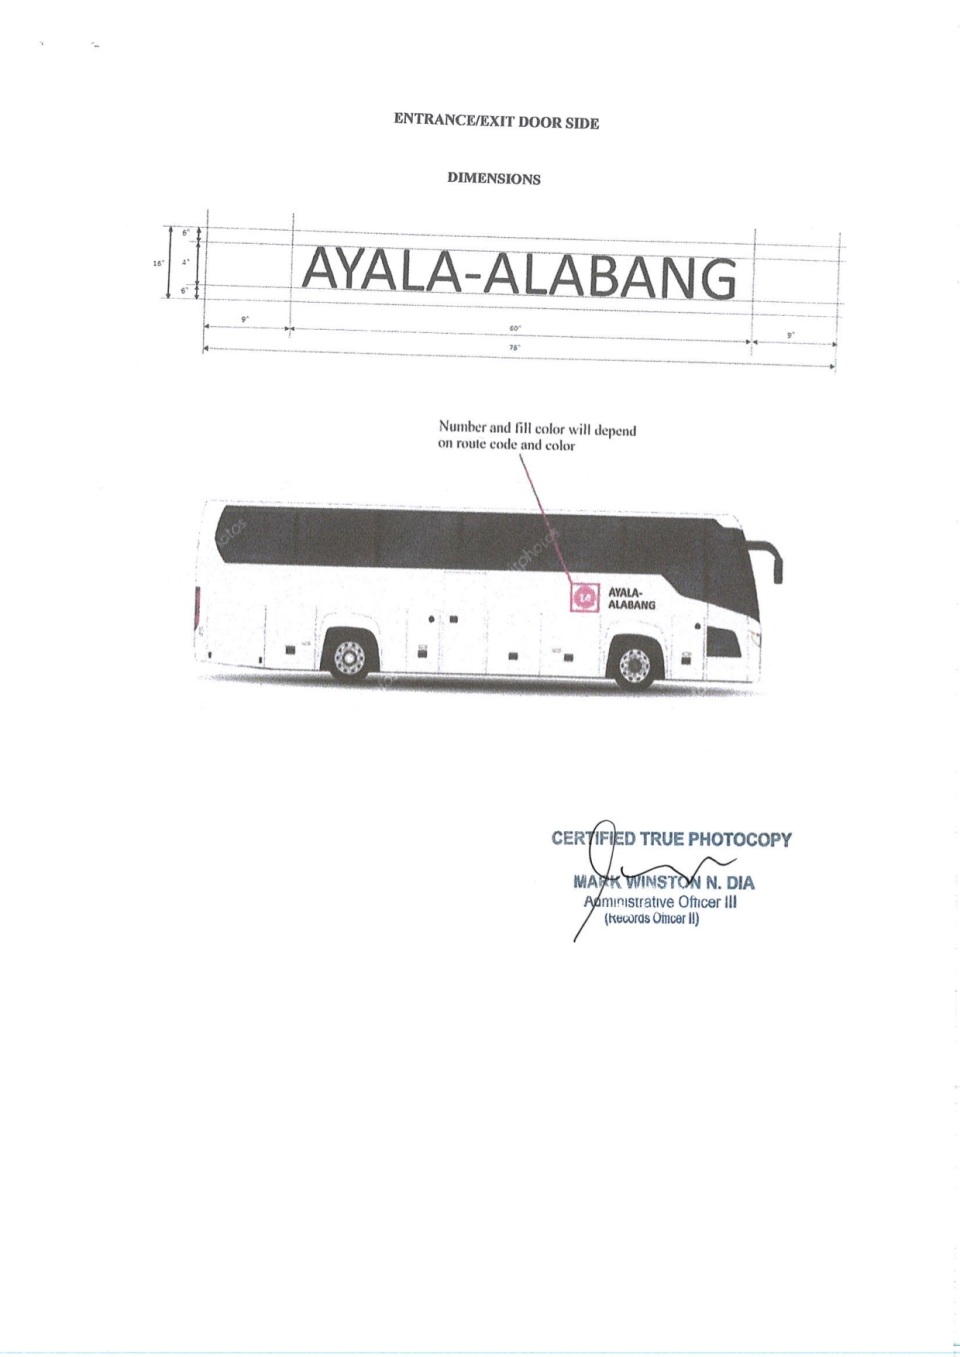
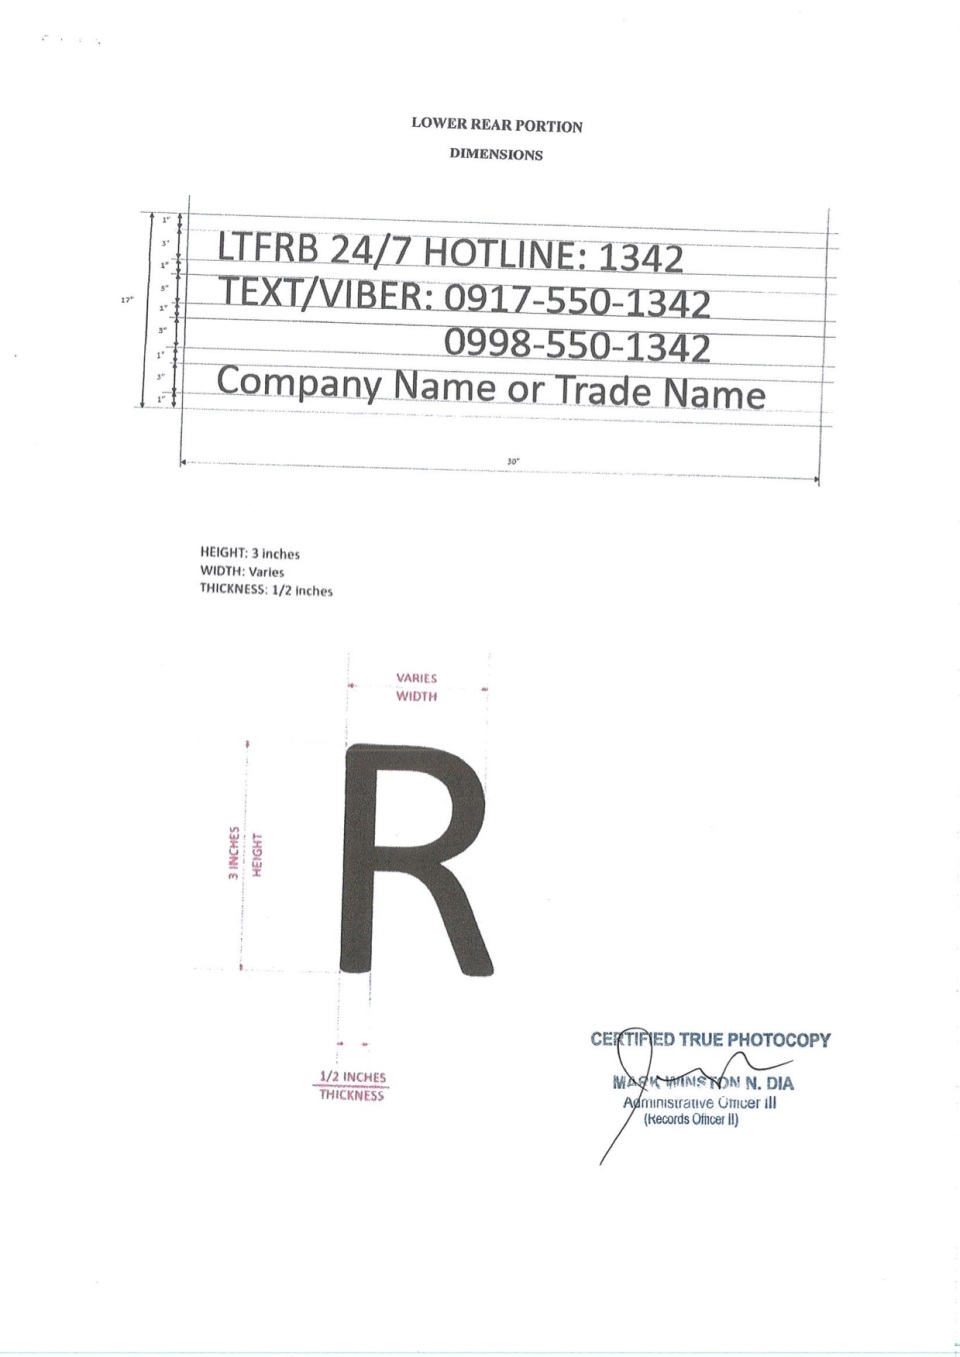
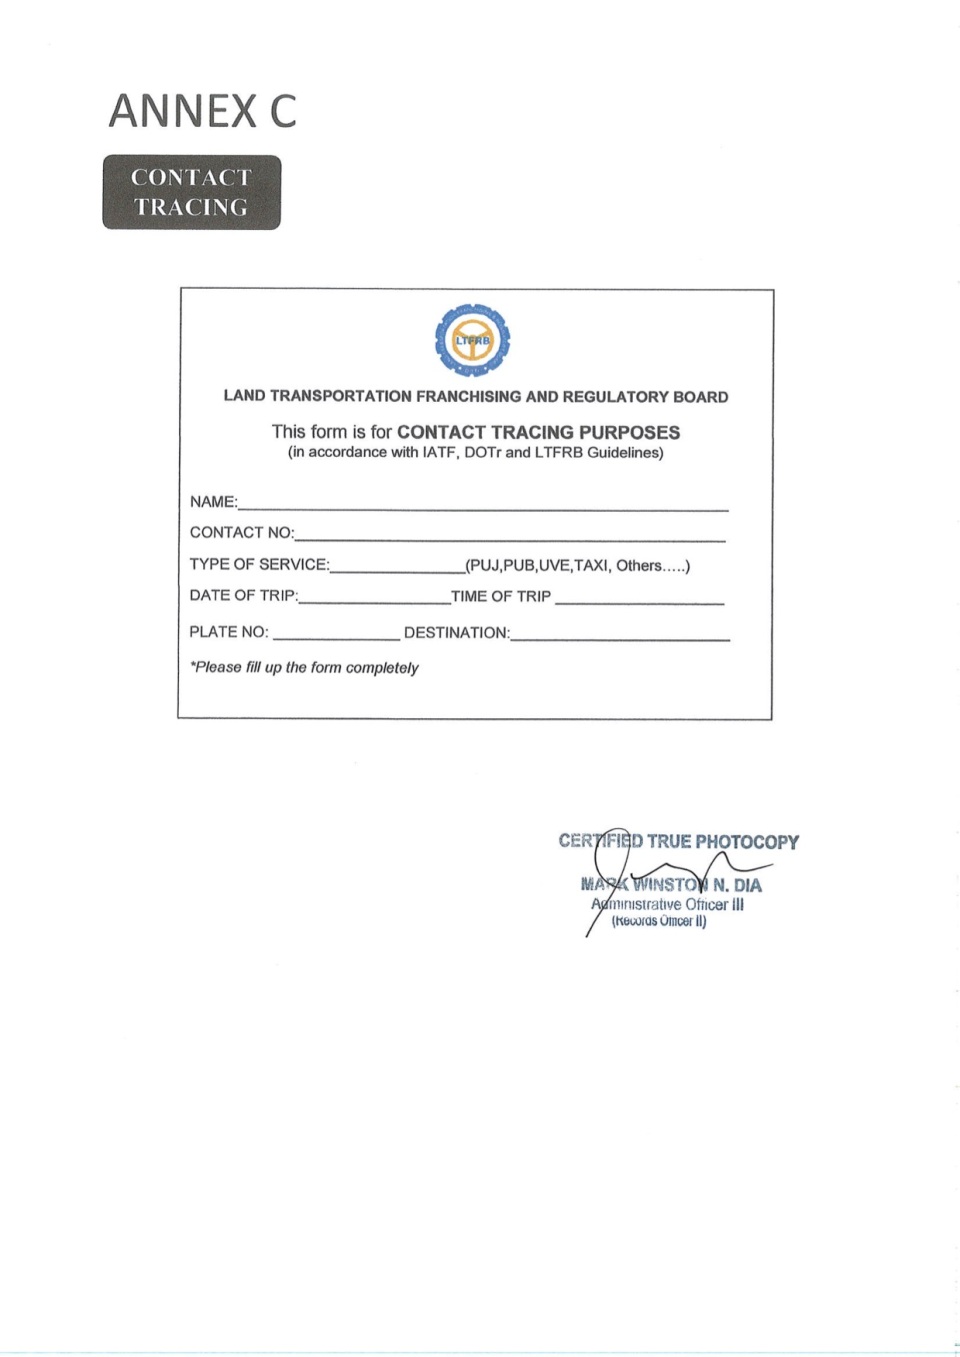
LTFRB Memorandum Circular No. 2020-019 – Guidelines for the Operations of PUBs During the Period of GCQ in Metro Manila
The following images show the full 19 pages of the Land Transportation Franchising and Regulatory Board Memorandum Circular No. 2020-019: Guidelines for the Operations of PUBs During the Period of GCQ in Metro Manila. Again, no comments for now as I post this for reference. I have not seen it posted on the LTFRB’s Facebook page yet but it is a public document and something that needs to be circulated for the benefit of the riding public.


–
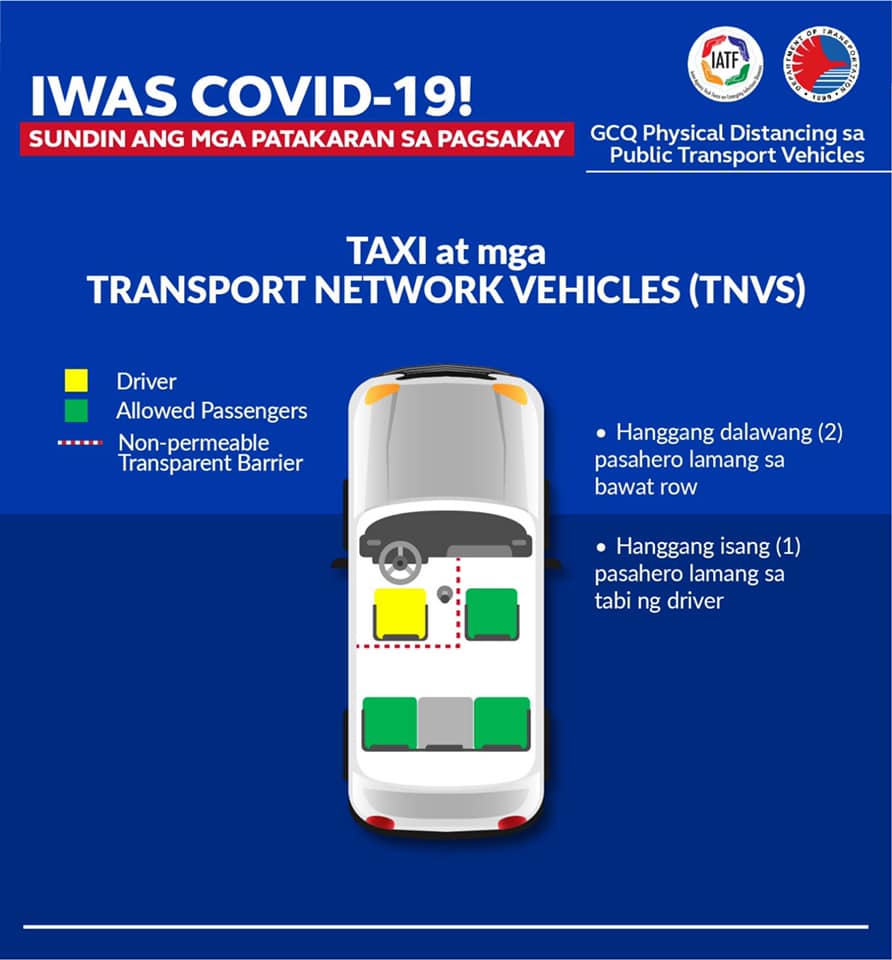
On the DOTr Guidelines for Public Transport – Layouts for Distancing
Here again, for reference, are the guidelines issued by the DOTr in relation to the transition from ECQ to GCQ and beyond (immediate rather than far future). The following images show the physical distancing prescribed for road transport.


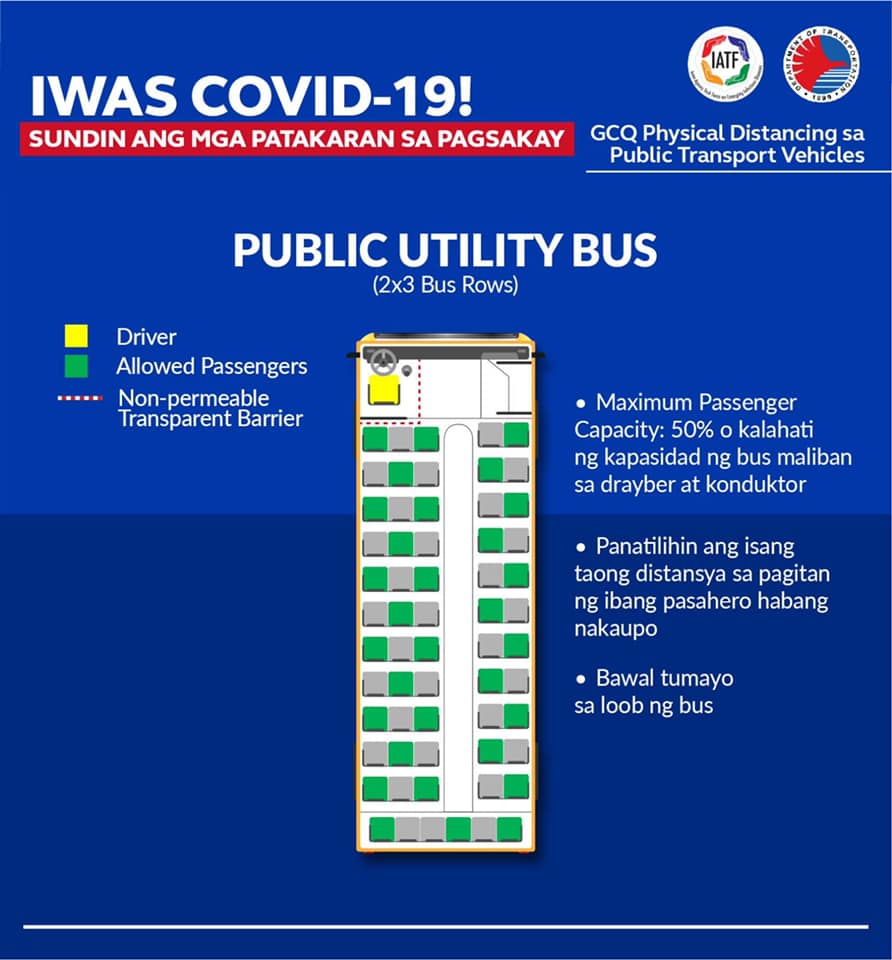


The last image for the tricycle is something that should have been allowed at least for a limited number of tricycles during the ECQ period. That could have eased transport woes for many people especially those who had to walk long distances in order to get their supplies. Some LGUs like Davao were able to issue Executive Orders to that effect that the IATF did not contend (or is Davao a special case?). Now, we see a lot of LGUs issuing EO’s and ordinances allowing public utility tricycles to operate again but limiting their numbers through odd-even schemes. Perhaps the same should be applied to pedicabs or padyak (non-motorized 3-wheelers), too.
–
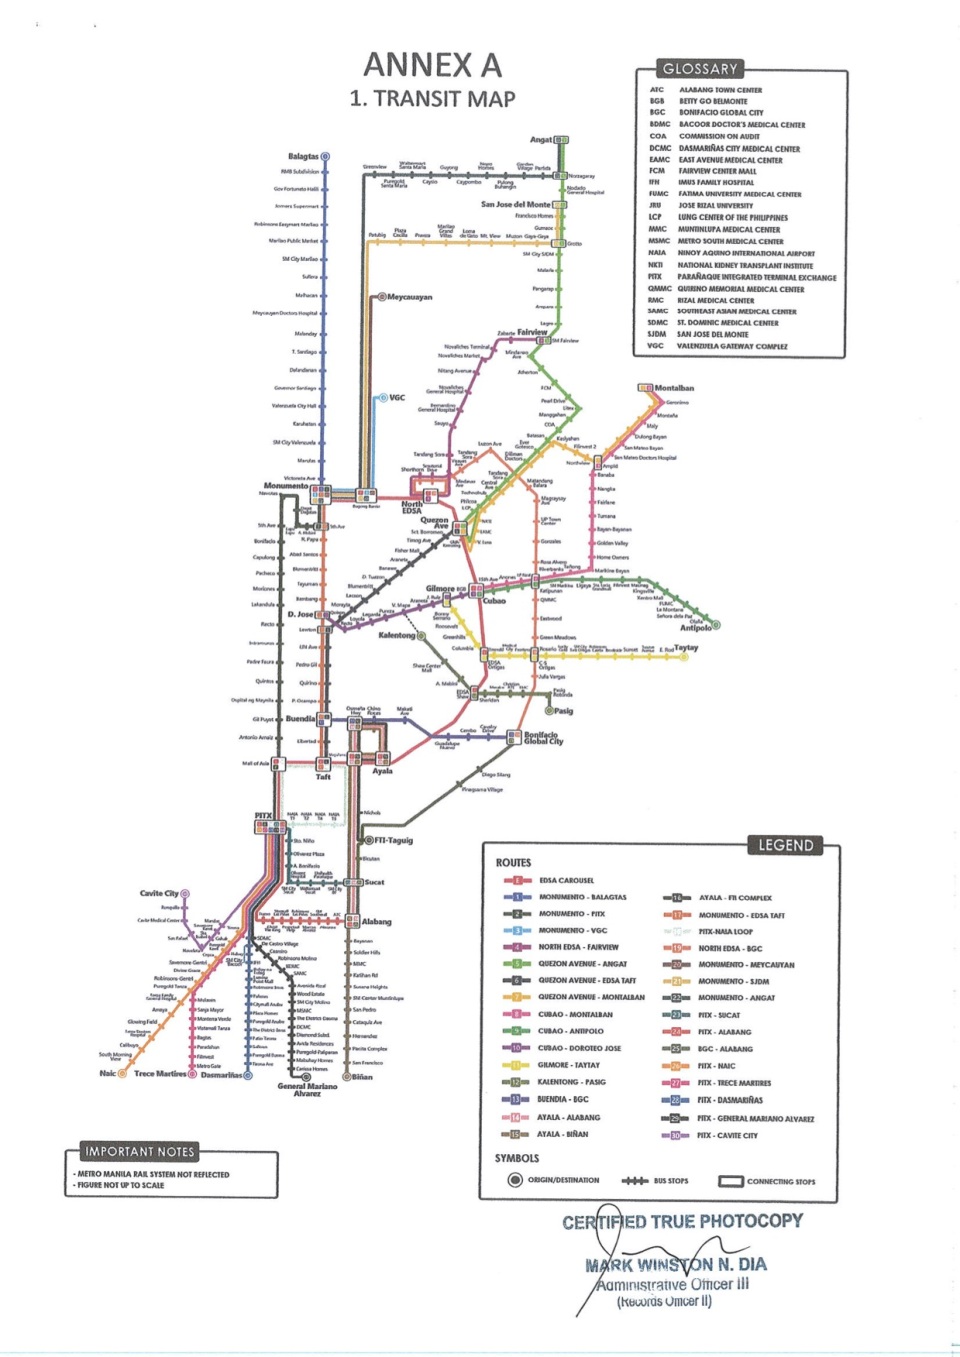
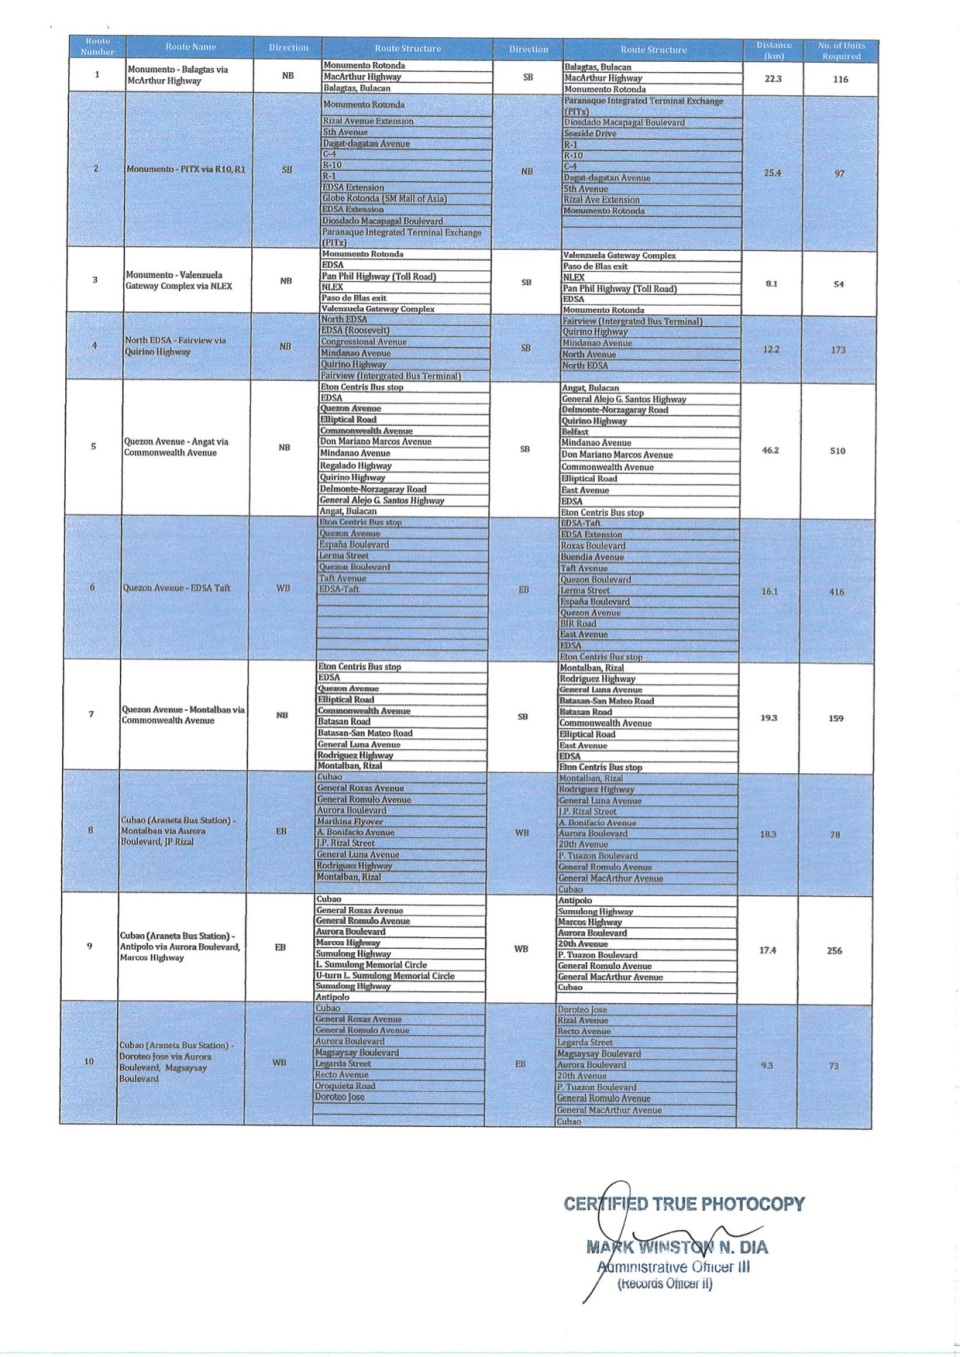
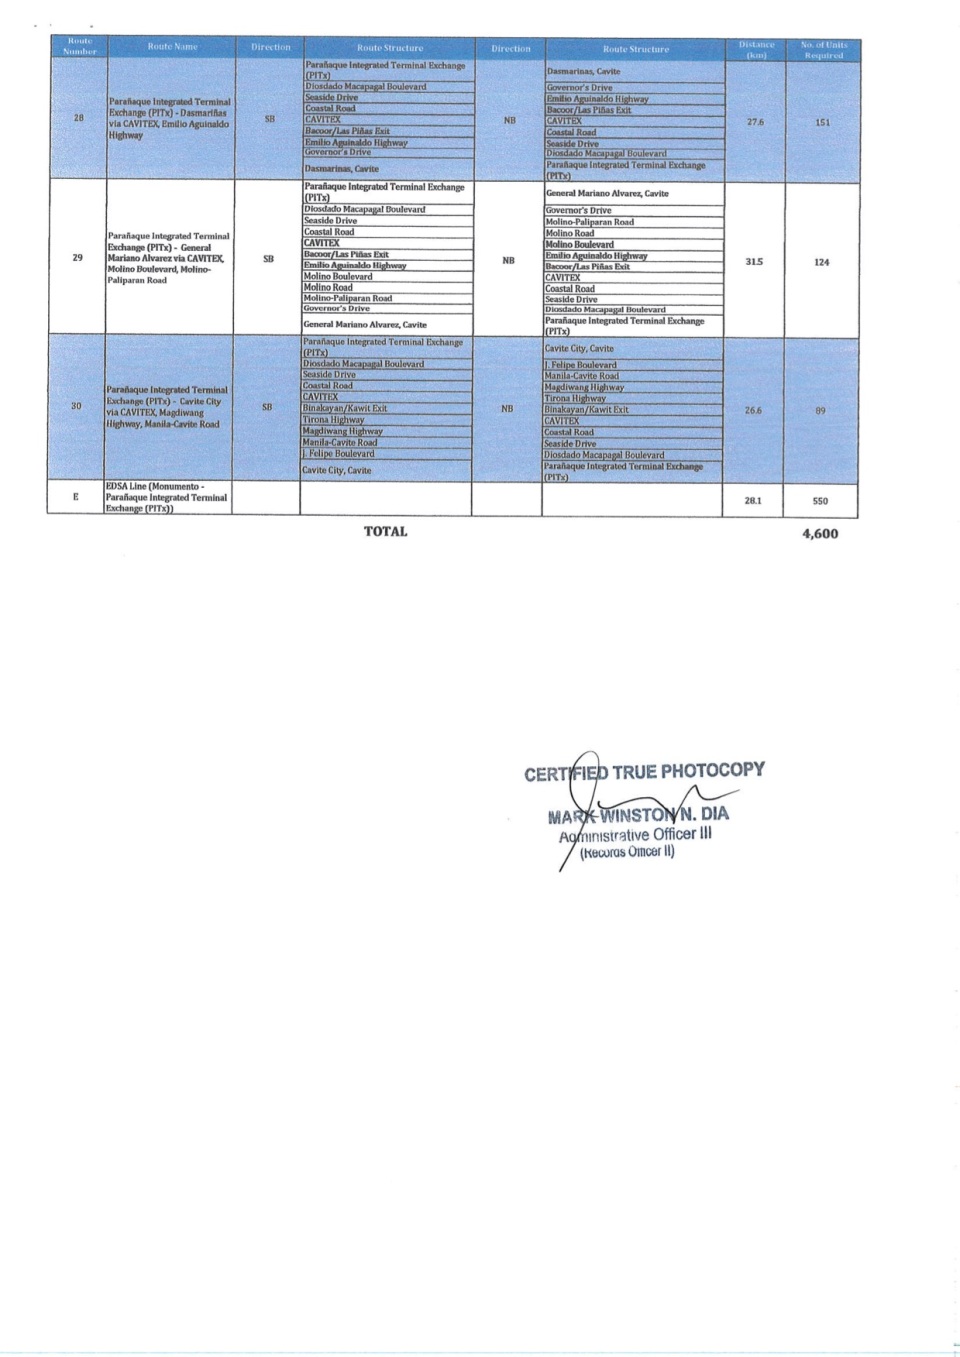
On the proposed single bus route along EDSA
A friend posted this on social media as news came out about the government’s statement on its considering a single bus route for EDSA. EDSA, of course, is Circumferential Road 4 and perhaps the busiest road in Metropolitan Manila in terms of volumes of people and vehicles traversing this road. Public transportation along EDSA is mainly by buses and the MRT Line 3. Line 3’s capacity is already diminished despite the high demand for it mainly because of the number of train sets that are currently in operation. Buses, meanwhile, are split among the many routes converging along much of EDSA. These routes are shown in the map on the left where you can see the overlapping routes that have various end points.


Of course, it is best to read the Final Report of this study. That way, one is able to see the overall context for this section that is part of the concluding part of the report. I recall that the consulting team from UP was able to map the routes of other public utility vehicles like jeepneys and UV Express from that time. Perhaps the DOTr still has a copy somewhere? The NCTS Library in UP Diliman is currently closed so one may have to search the internet first for a copy of the study or perhaps snippets of it here and there. Perhaps related to this is a proposal to revive (or maybe the right word is ‘resurrect’?) the now defunct Metro Manila Transit Corporation or MMTC that used to dominate EDSA and other major roads in direct competition with the few private bus companies during its heydays as well as the jeepneys.
–
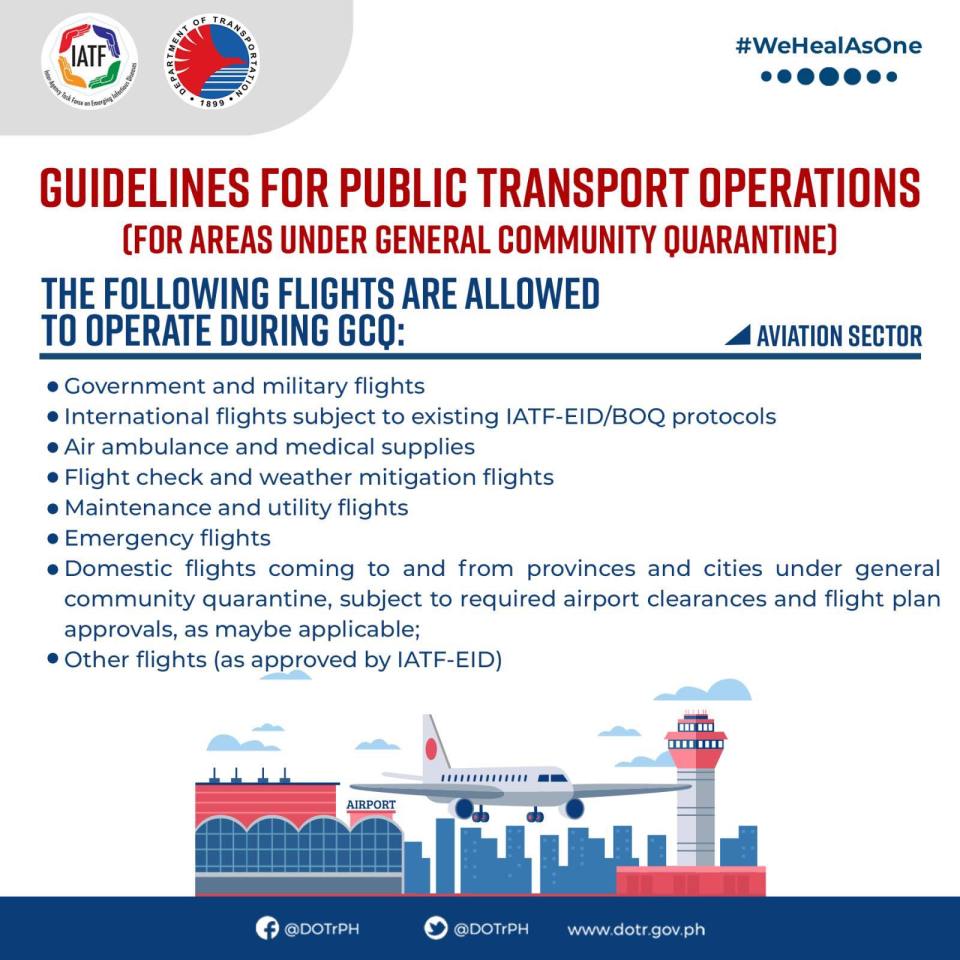
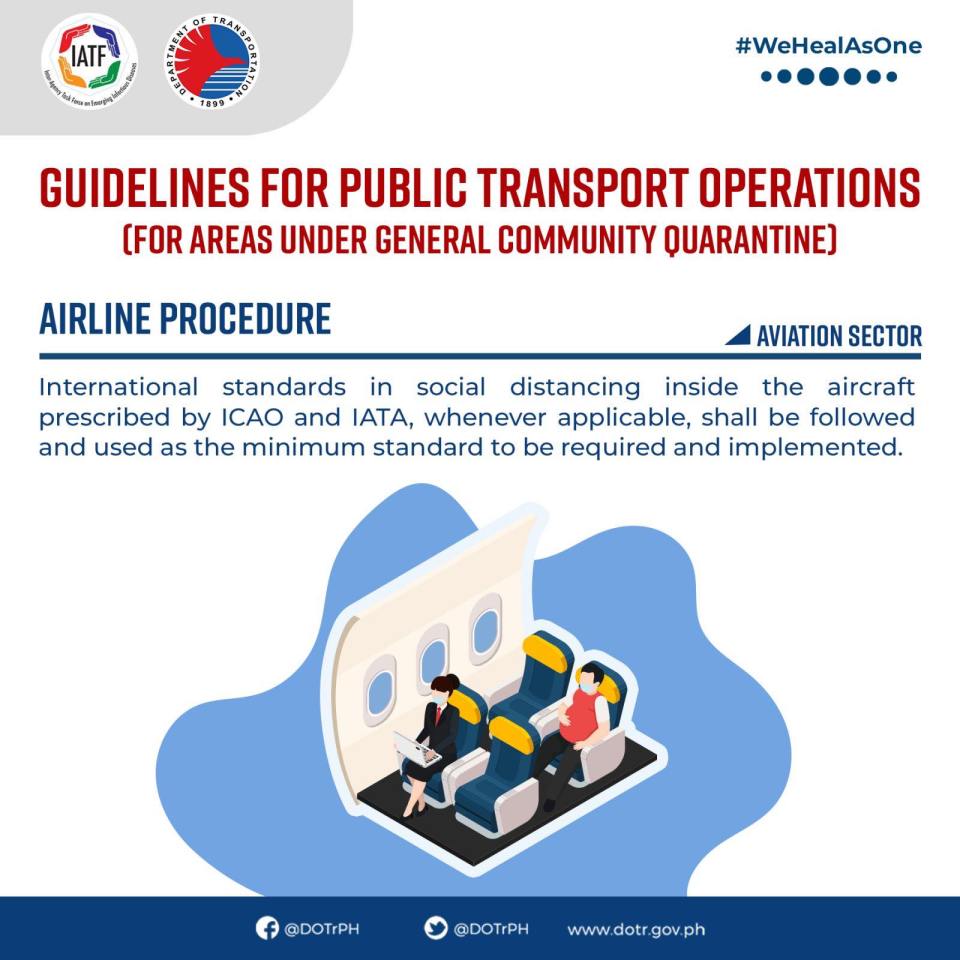
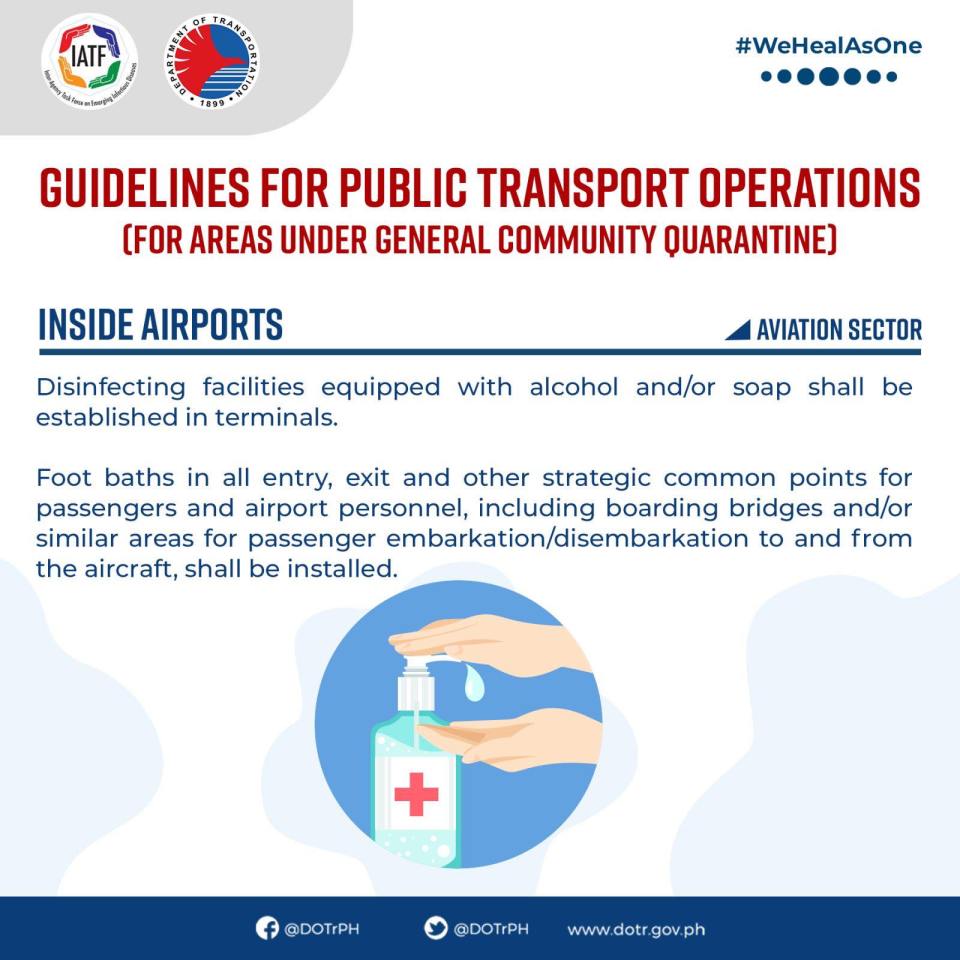
On the DOTr Guidelines for Public Transport – Aviation Sector
Here are the guidelines for the Aviation Sector. My only comment here is that many people are anxious about when they can travel again, particularly to other parts of the country mainly for business or to go home (e.g., many students have been stranded in the cities where they go to school and away from their hometowns). Part of this anxiety is the thinking that airfares will increase significantly as airlines are forced to reduce capacities for their aircraft to adhere to physical distancing guidelines. Gone, probably, are the discount fares like the Piso fare promos.

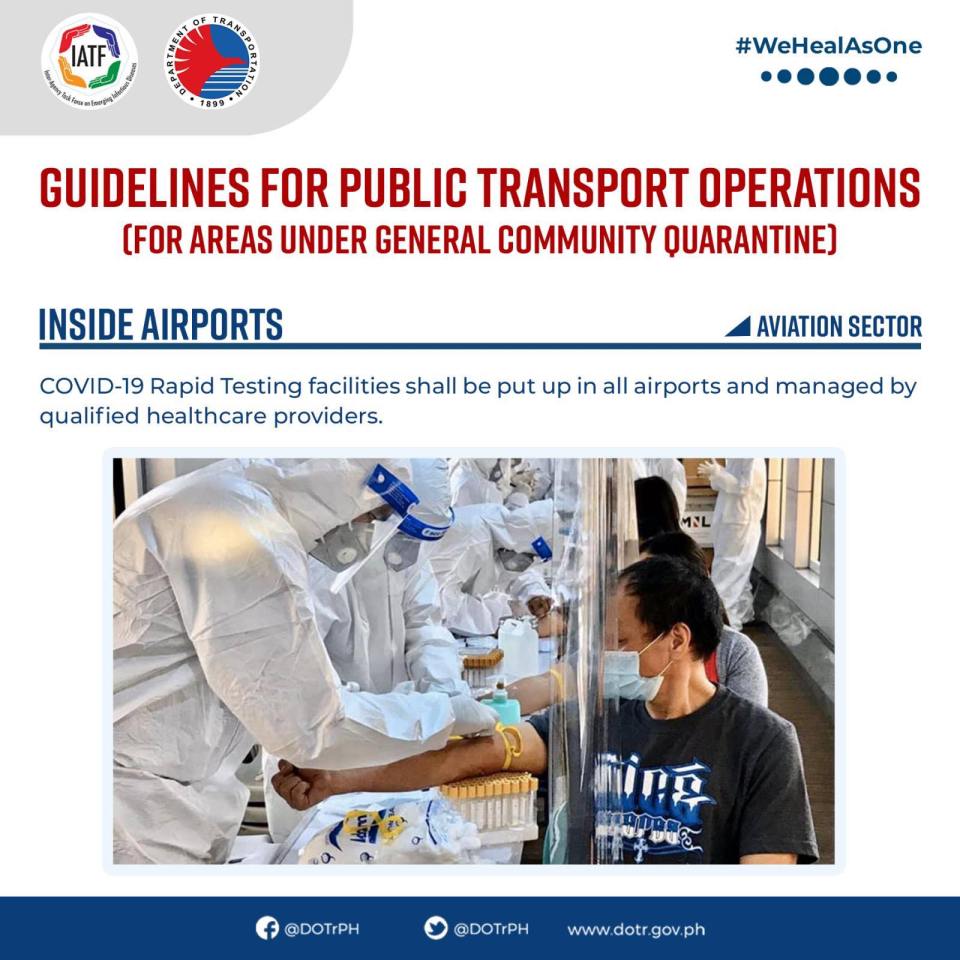


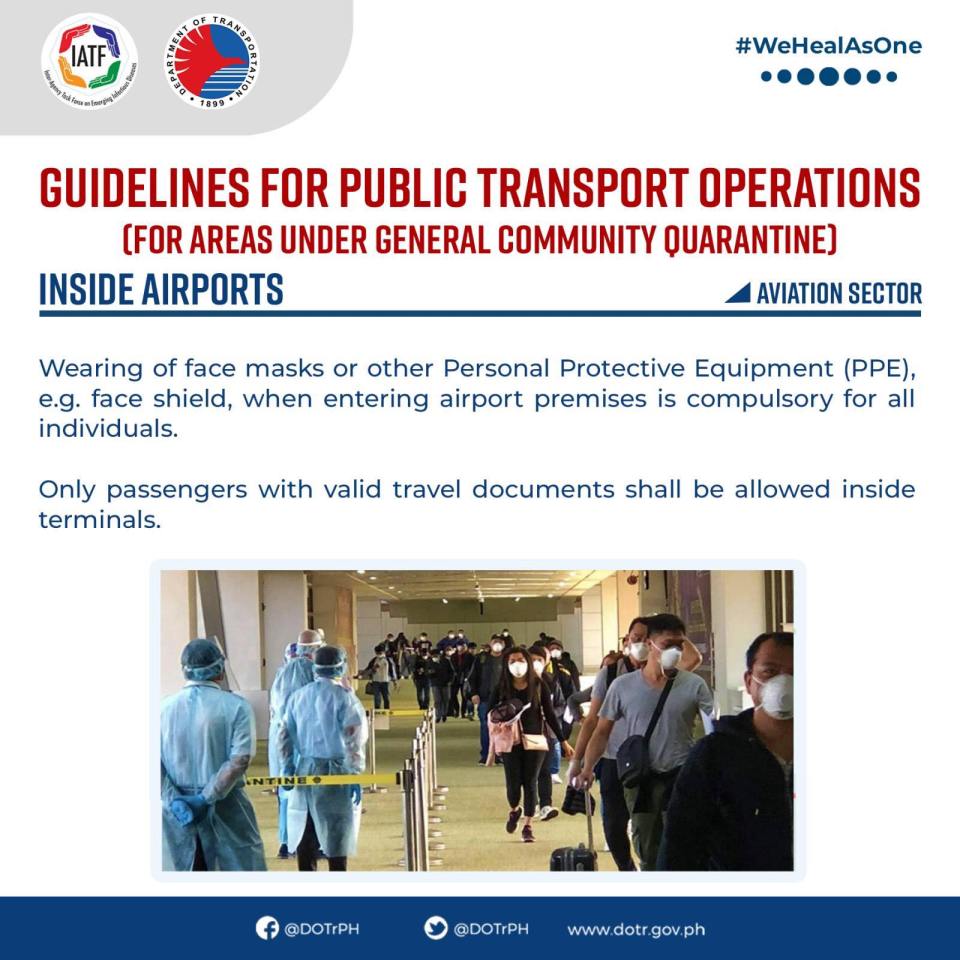


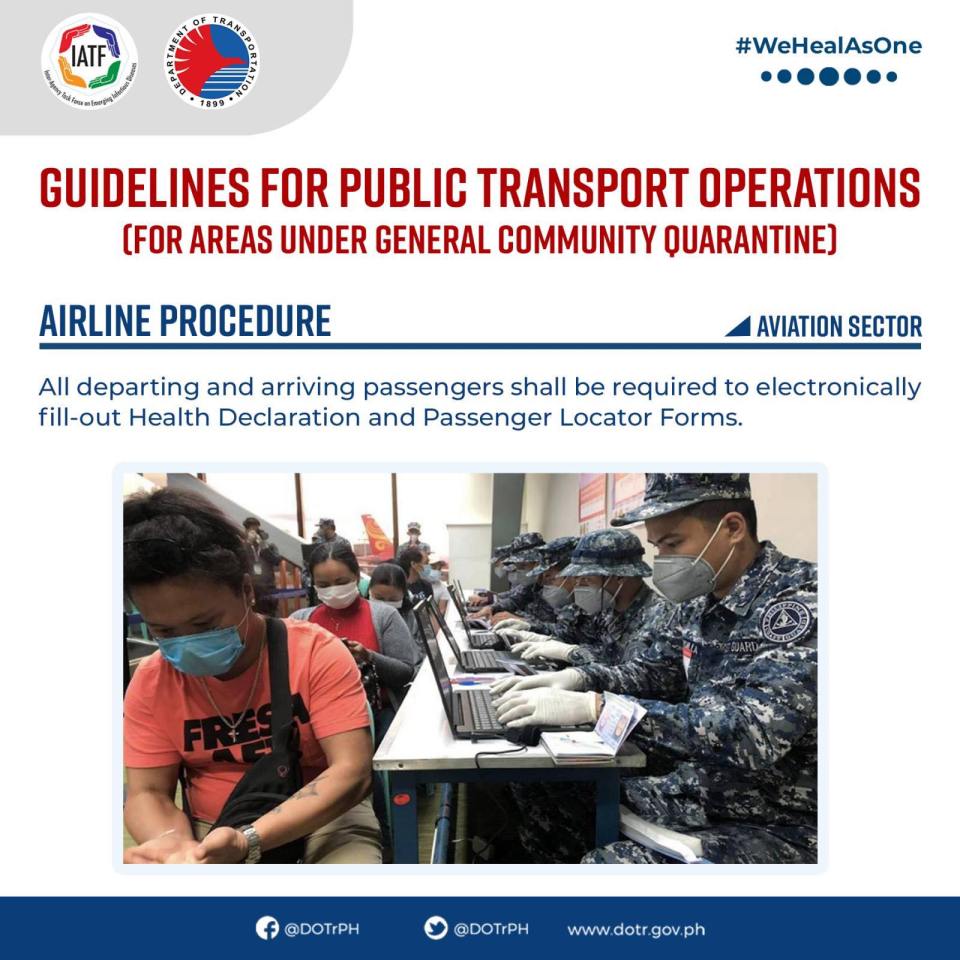

Related to this, I have received emails from 4 airlines I frequently used – Cebu Pacific, Philippine Airlines, Singapore Airlines and Japan Airlines. All provided updates on their respective efforts to ensure the future air travel will be safe, health-wise. As for the airport terminals, that’s another story…
–
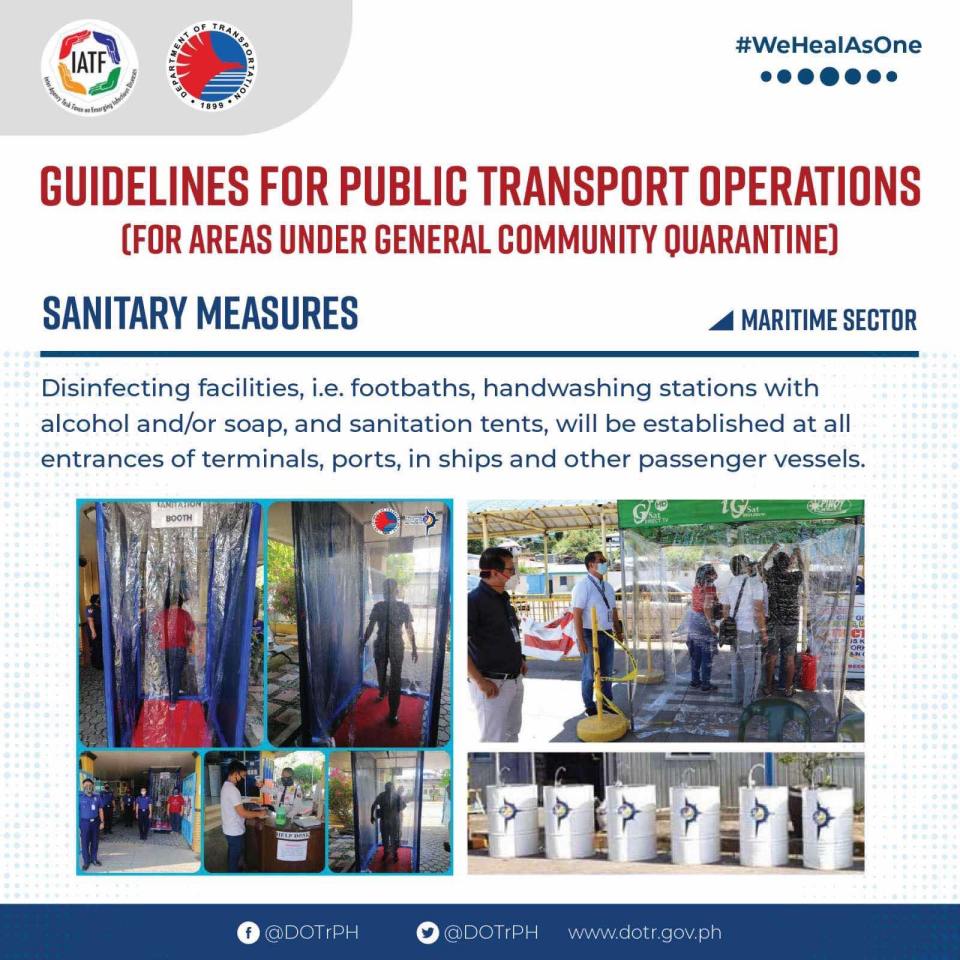
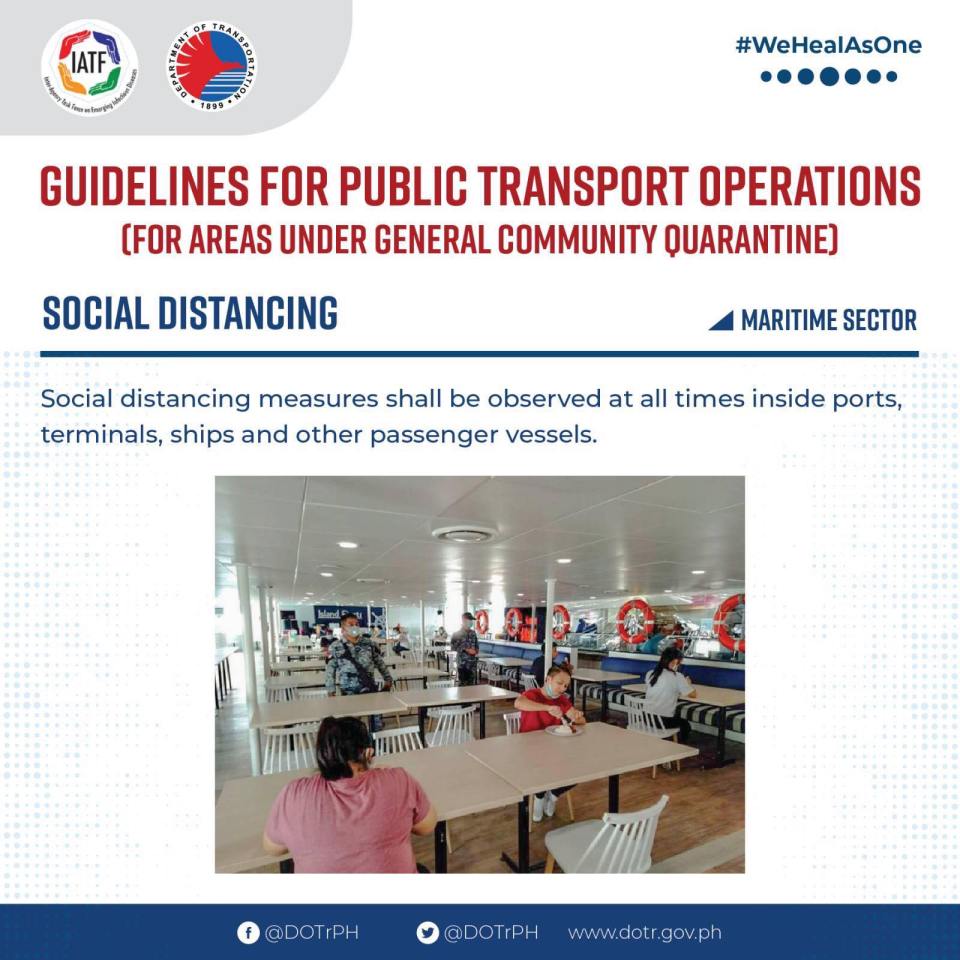
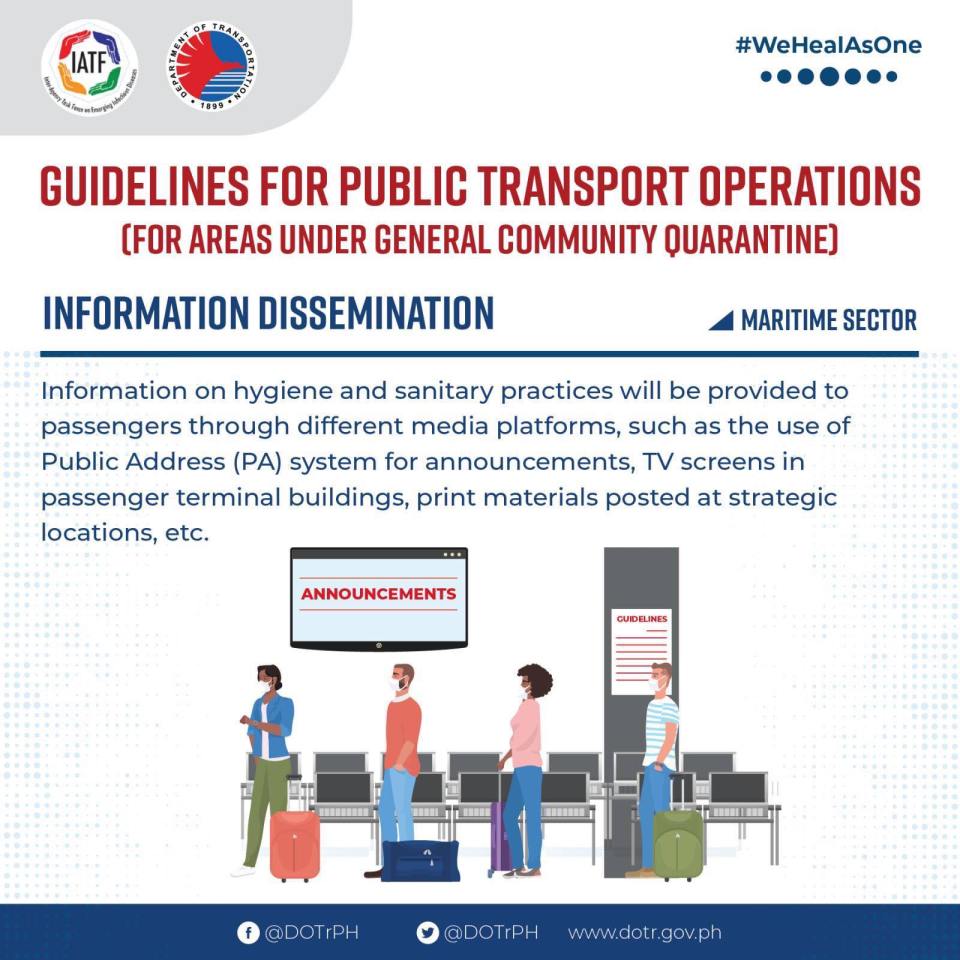
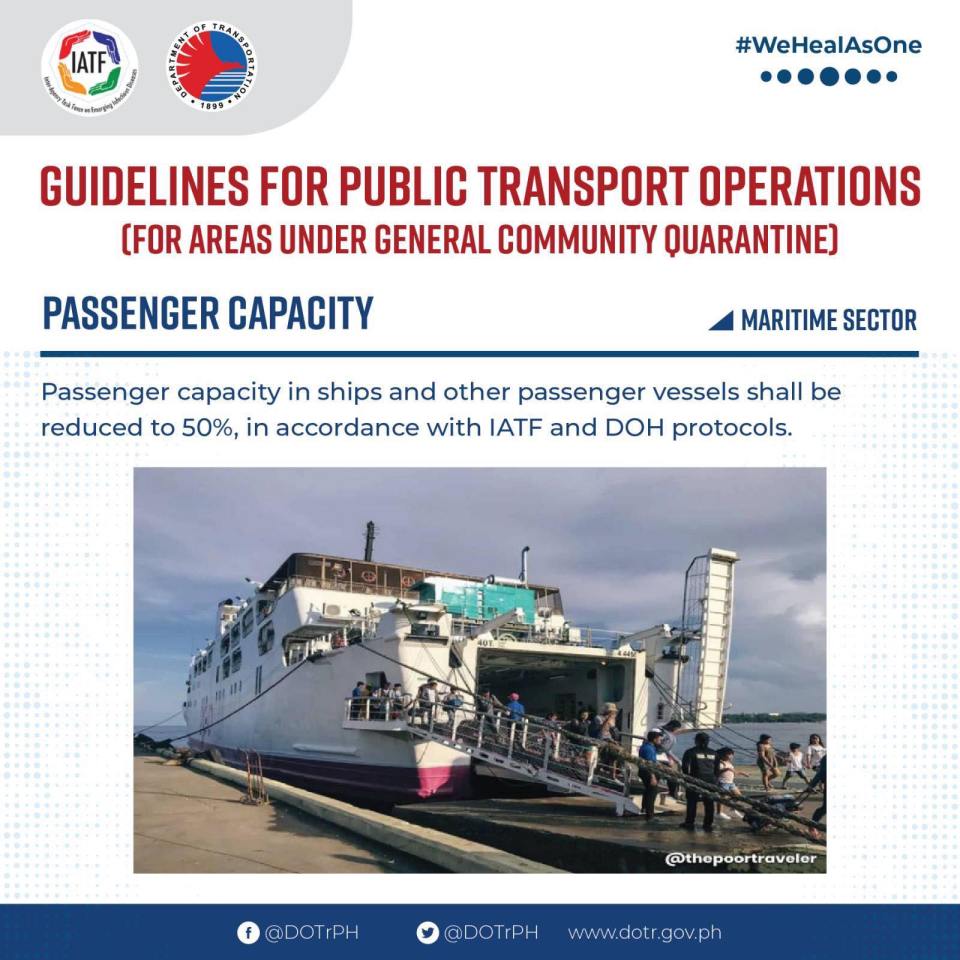
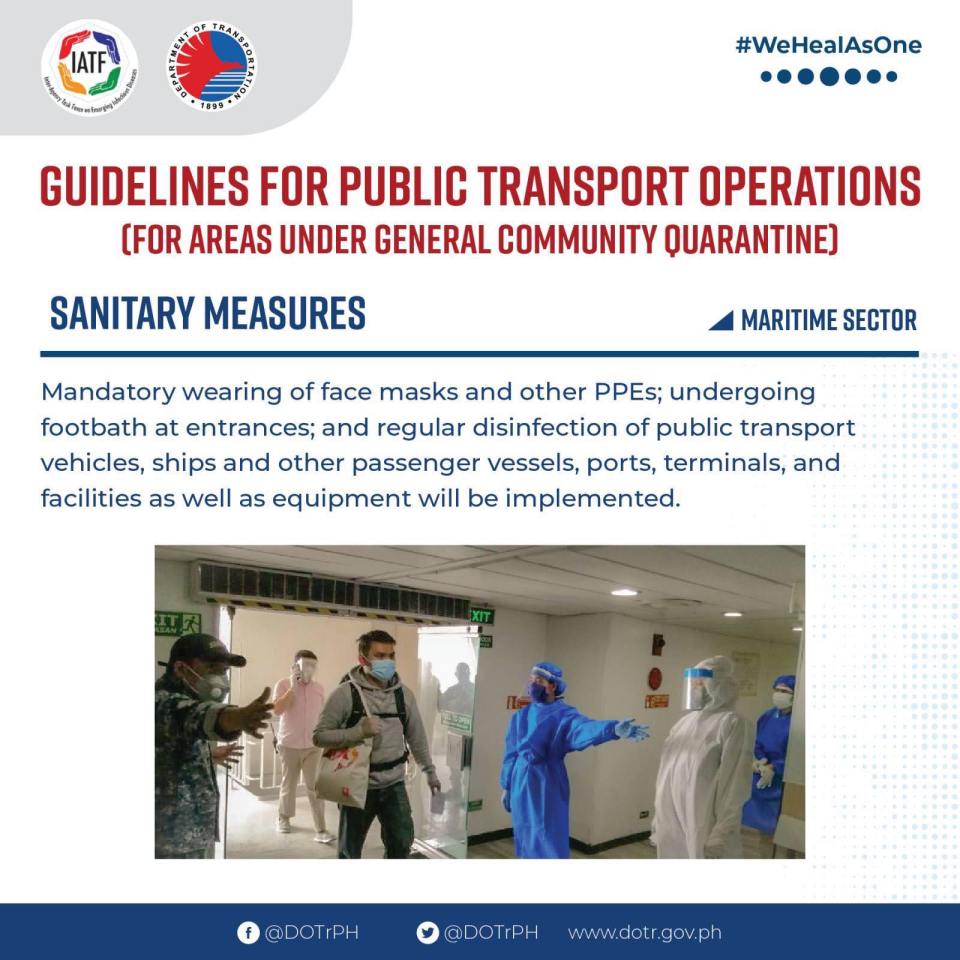
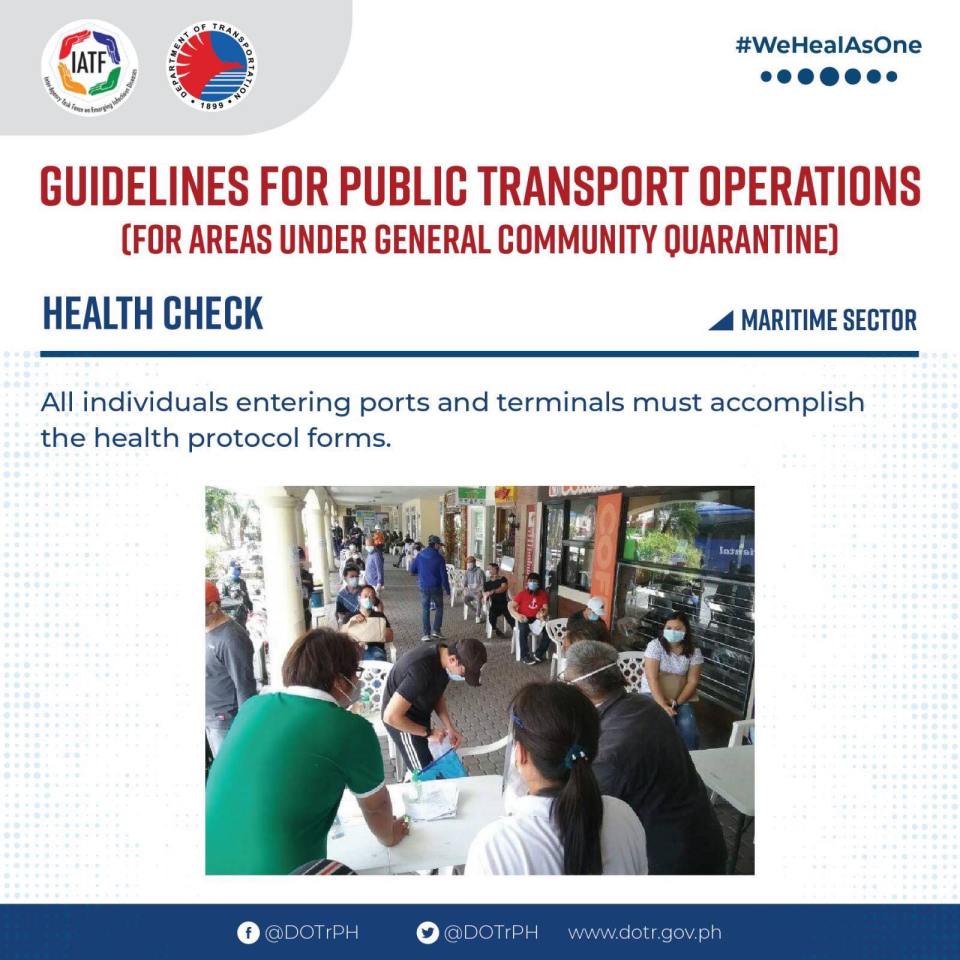
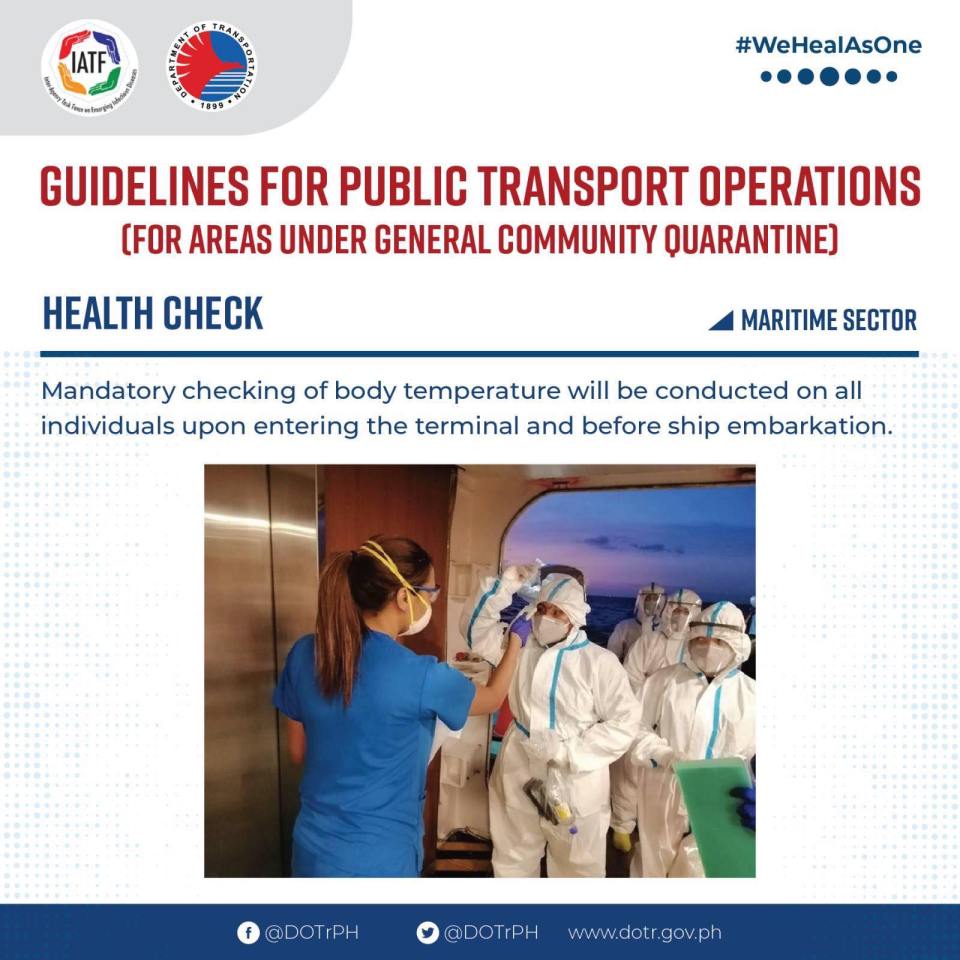
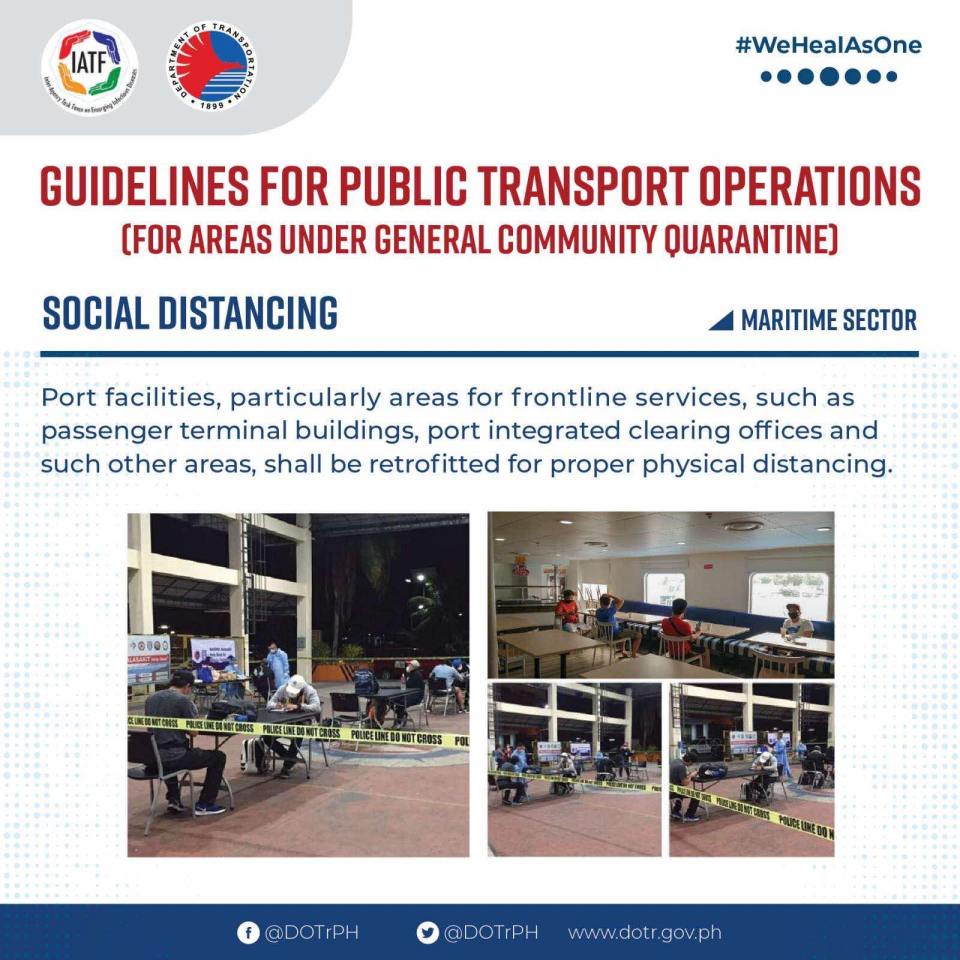
On the DOTr for Public Transport – Maritime Sector
Here’s a continuation of the set of guidelines issued by the Department of Transportation for transport operations for areas that are or will be under the General Community Quarantine (GCQ). Again, I try to refrain from making any critiques or comments, and post this for information and reference.
–
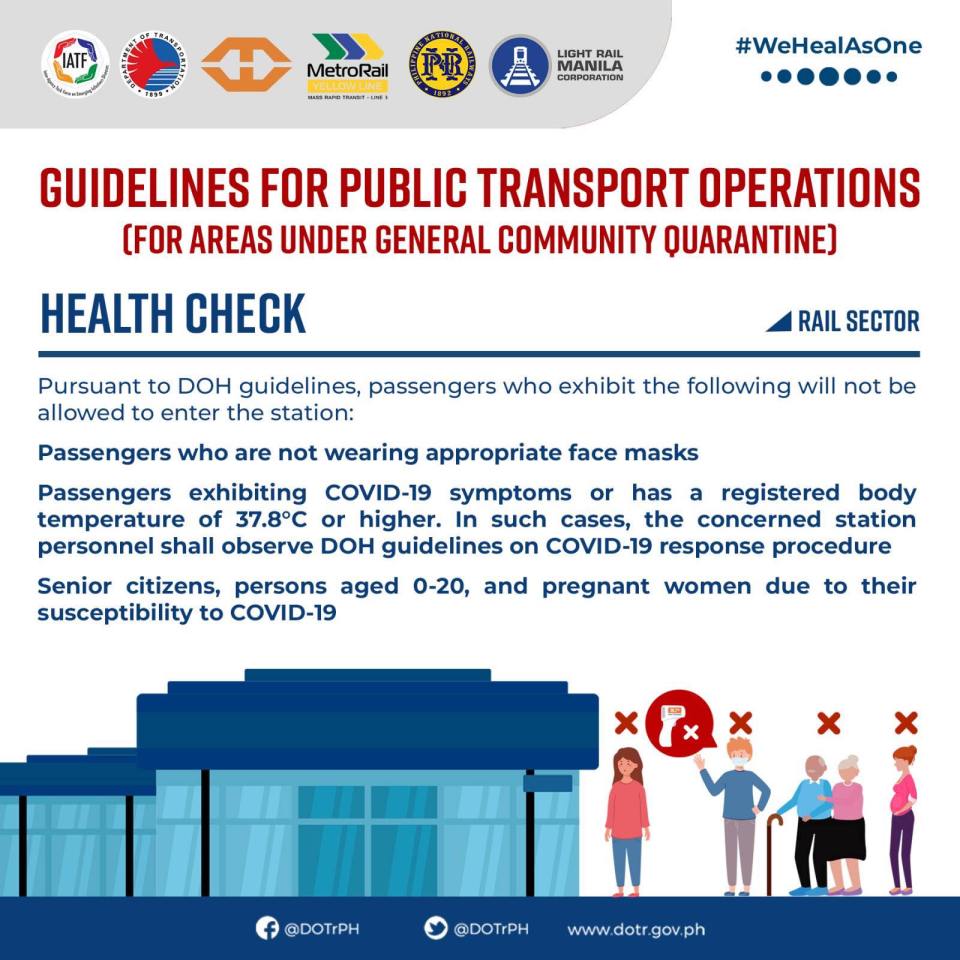
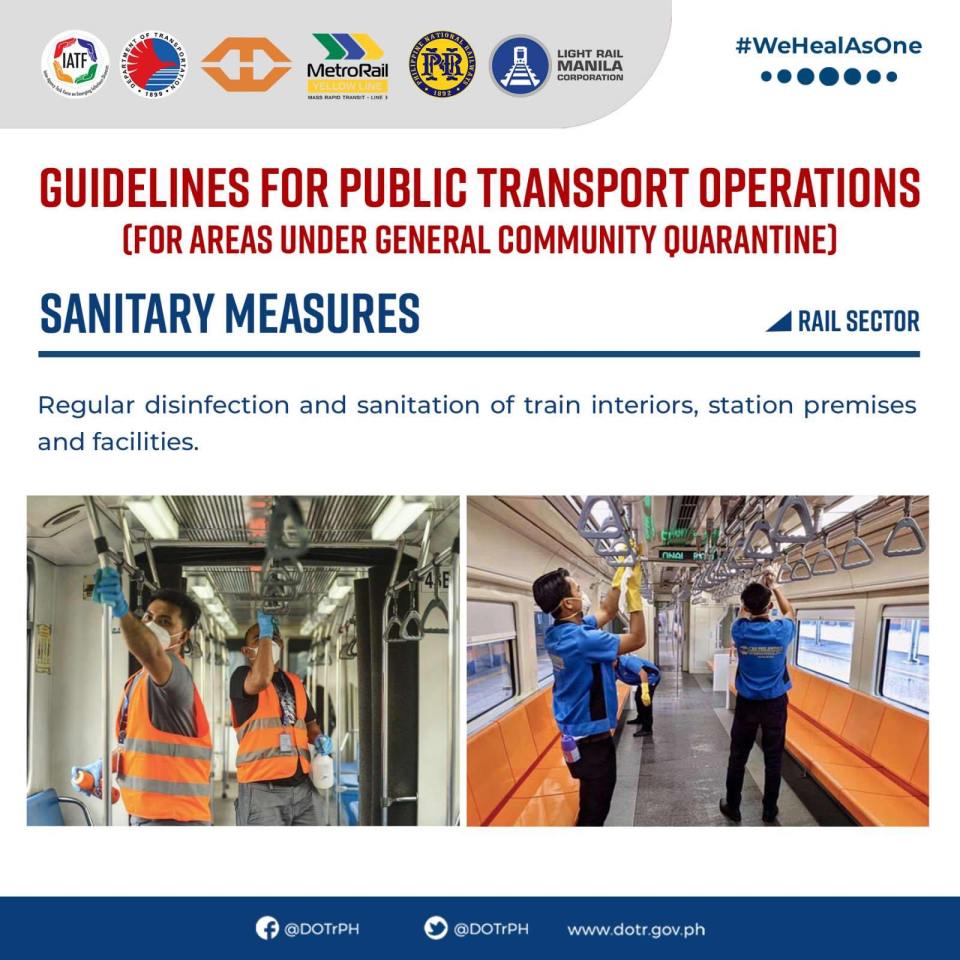
On the DOTr GCQ Guidelines for Public Transport Operations – Rail Sector
I had previously posted for information and reference the Department of Transportation’s (DOTr) guidelines for road public transportation. Here are the guidelines for rail public transportation:
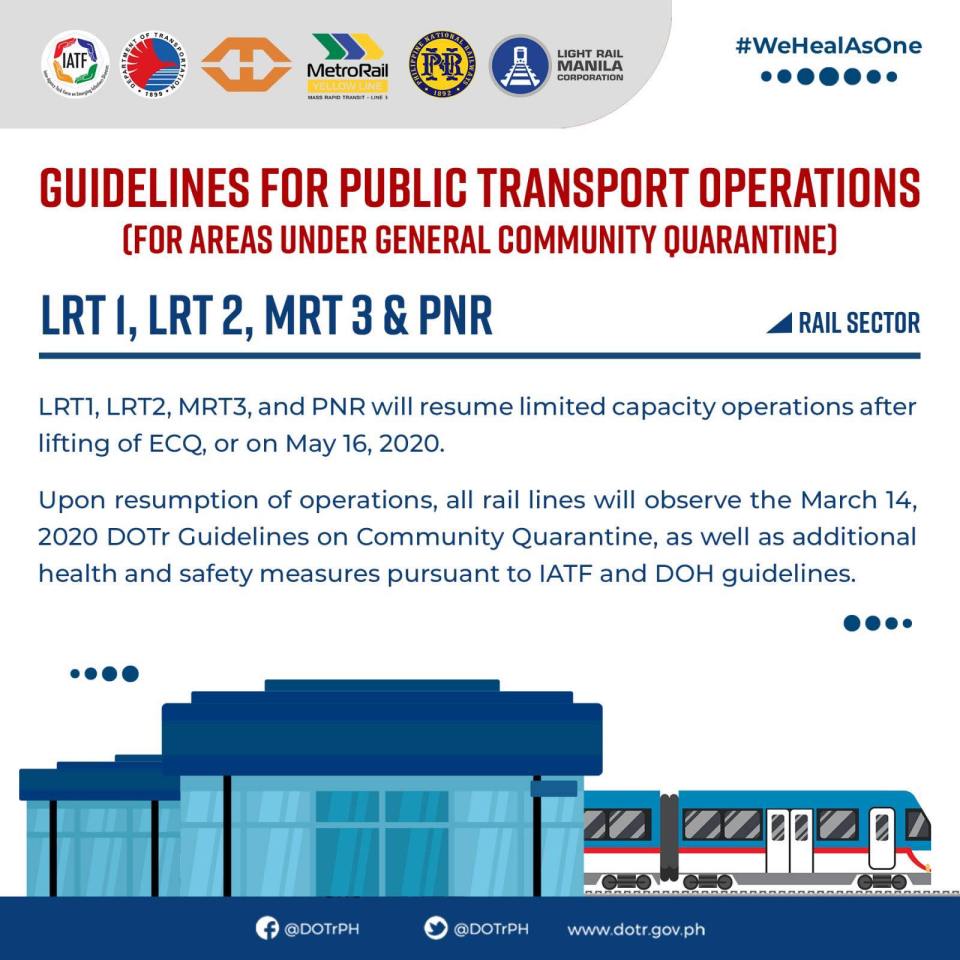
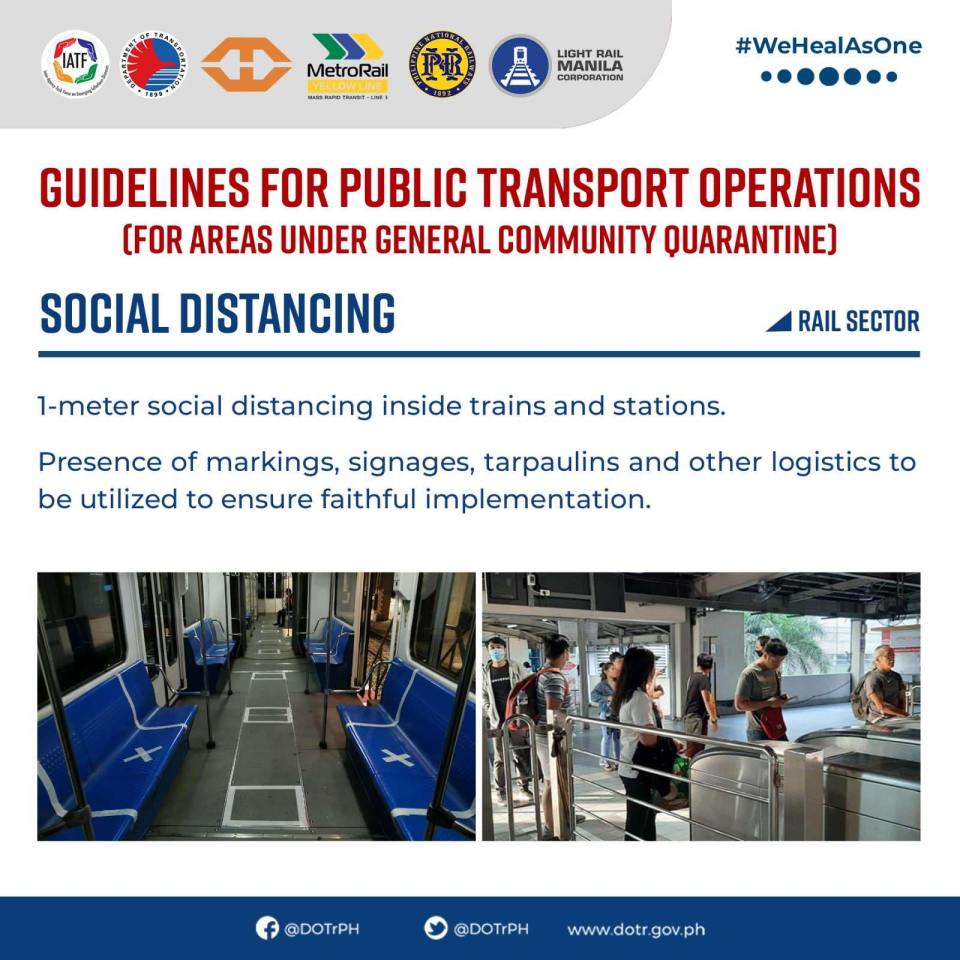


While I said that I will refrain from commenting or critiquing these guidelines starting from the previous post on road public transport, I could not help but say a few things about the case for rail. In particular, I am most concerned about the reduced capacity of trains based on the infographics above. The particular infographic states that passenger capacities for Line 1, Line 2, Line 3 and PNR would be 12, 10, 13 and 20 percent, respectively. These are very low numbers that are not even comparable to the 30 to 50% passenger capacities that road public transportation may be able to achieve. Would it be worth it (and I’m talking about financial terms here) to operate at these capacities? Or are there solutions that could increase train passenger capacities while ensuring physical separation. I use the term “physical separation” here instead of “physical distancing” because it may be possible to design not just a layout but barriers that would also be effective in minimizing if not eliminating the possibility of infection of the virus should any passenger turn out to be infected. People, after all, will be required to wear masks and even gloves. Others may opt to wear face shields. And there are also measures vs infection at the stations or terminals as well as the workplaces. What do you think?
–
