
Home » active transport (Page 12)
Category Archives: active transport
Cities and Automobile Dependence: What Have We Learned?
We end the year with an article from Todd Litman via Planetizen. The topic is something that we really need to ponder on as we or if we are to move towards more sustainable transportation for our cities and municipalities. The experiences during this Covid-19 pandemic should have provided us glimpses of how it could be if we put active and public transport above automobile dependence or car-centricity.
Source: Cities and Automobile Dependence: What Have We Learned?
The main article may be found here (in proper citation for academic/researchers reading this):
–
Lessons to be learned about e-scooters
I recently wrote about e-scooters and I am sharing this article on the experience of Chicago from their pilots of this emerging new mobility option.
I won’t be offering much in terms of opinions at this point as there really hasn’t been much about e-scooters at present in the country. You see them every now and again but not as frequently as motorcycles and bicycles. There seems to be something about them on social media but out on the road, they are not yet significant in terms of volume but are a concern regarding safety.
–
On e-scooters
One of the so-called new mobility modes is the e-scooter. It is categorized as a micro mobility mode and in appearance is no different from a kick scooter with the difference lies in the former being motorized. Not all are powered by electric motors as I’ve seen ones that are gas-powered (small internal combustion engines). The latter are noisy and have emissions but seem to be more powerful especially when encountering inclined road sections (e.g., going up to Ortigas Center from C5, going up to Antipolo). Some seem to be customized for more power as I’ve seen motorcycle shops doing what looks like modifications and not just repairs.

I’m sharing an article below about e-scooters and their involvement in road crashes in Europe:
Meaker, M. (December 7, 2021) “E-scooters are everywhere in Europe. So are grisly accidents,” Wired, https://www.wired.com/story/escooters-accidents-europe/?bxid=5bd6761b3f92a41245dde413&cndid=37243643&esrc=AUTO_OTHER&source=EDT_WIR_NEWSLETTER_0_DAILY_ZZ&utm_brand=wired&utm_campaign=aud-dev&utm_content=WIR_Daily_120721&utm_mailing=WIR_Daily_120721&utm_medium=email&utm_source=nl&utm_term=P4 [Last accessed: 12/9/2021]
I think the proverbial jury is still out there in as far as these vehicles are concerned. Safety-wise, there should be concern if users speed up and zig-zag through traffic. These are the same concerns in the European cities mentioned in the article. Personally, I don’t see these vehicles gaining as much popularity for typical commutes compared to the bicycle, which has seen a surge in use during this pandemic and with bike lanes (pop-up and permanent) in place in many areas. These same bike lanes are now also being shared by these e-scooters. I think more people will opt for the motorcycle, which comes in different sizes and engines, and which provides more in terms of versatility of use. But again, there are risks involved here and perhaps some e-scooter users are mimicking the undesirable, risky motorcycle rider behavior. Are they e-scooter users to be regarded and treated as drivers or riders considering they are using motorized vehicles? Perhaps the government should be working on this and other relevant, current policy (if not regulations) to e-scooter use.
–
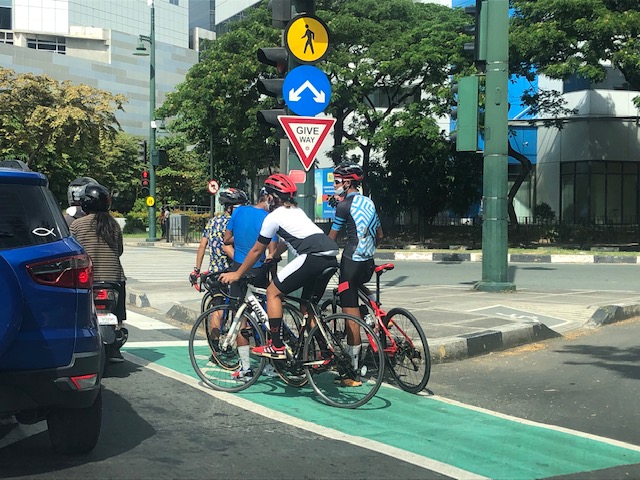
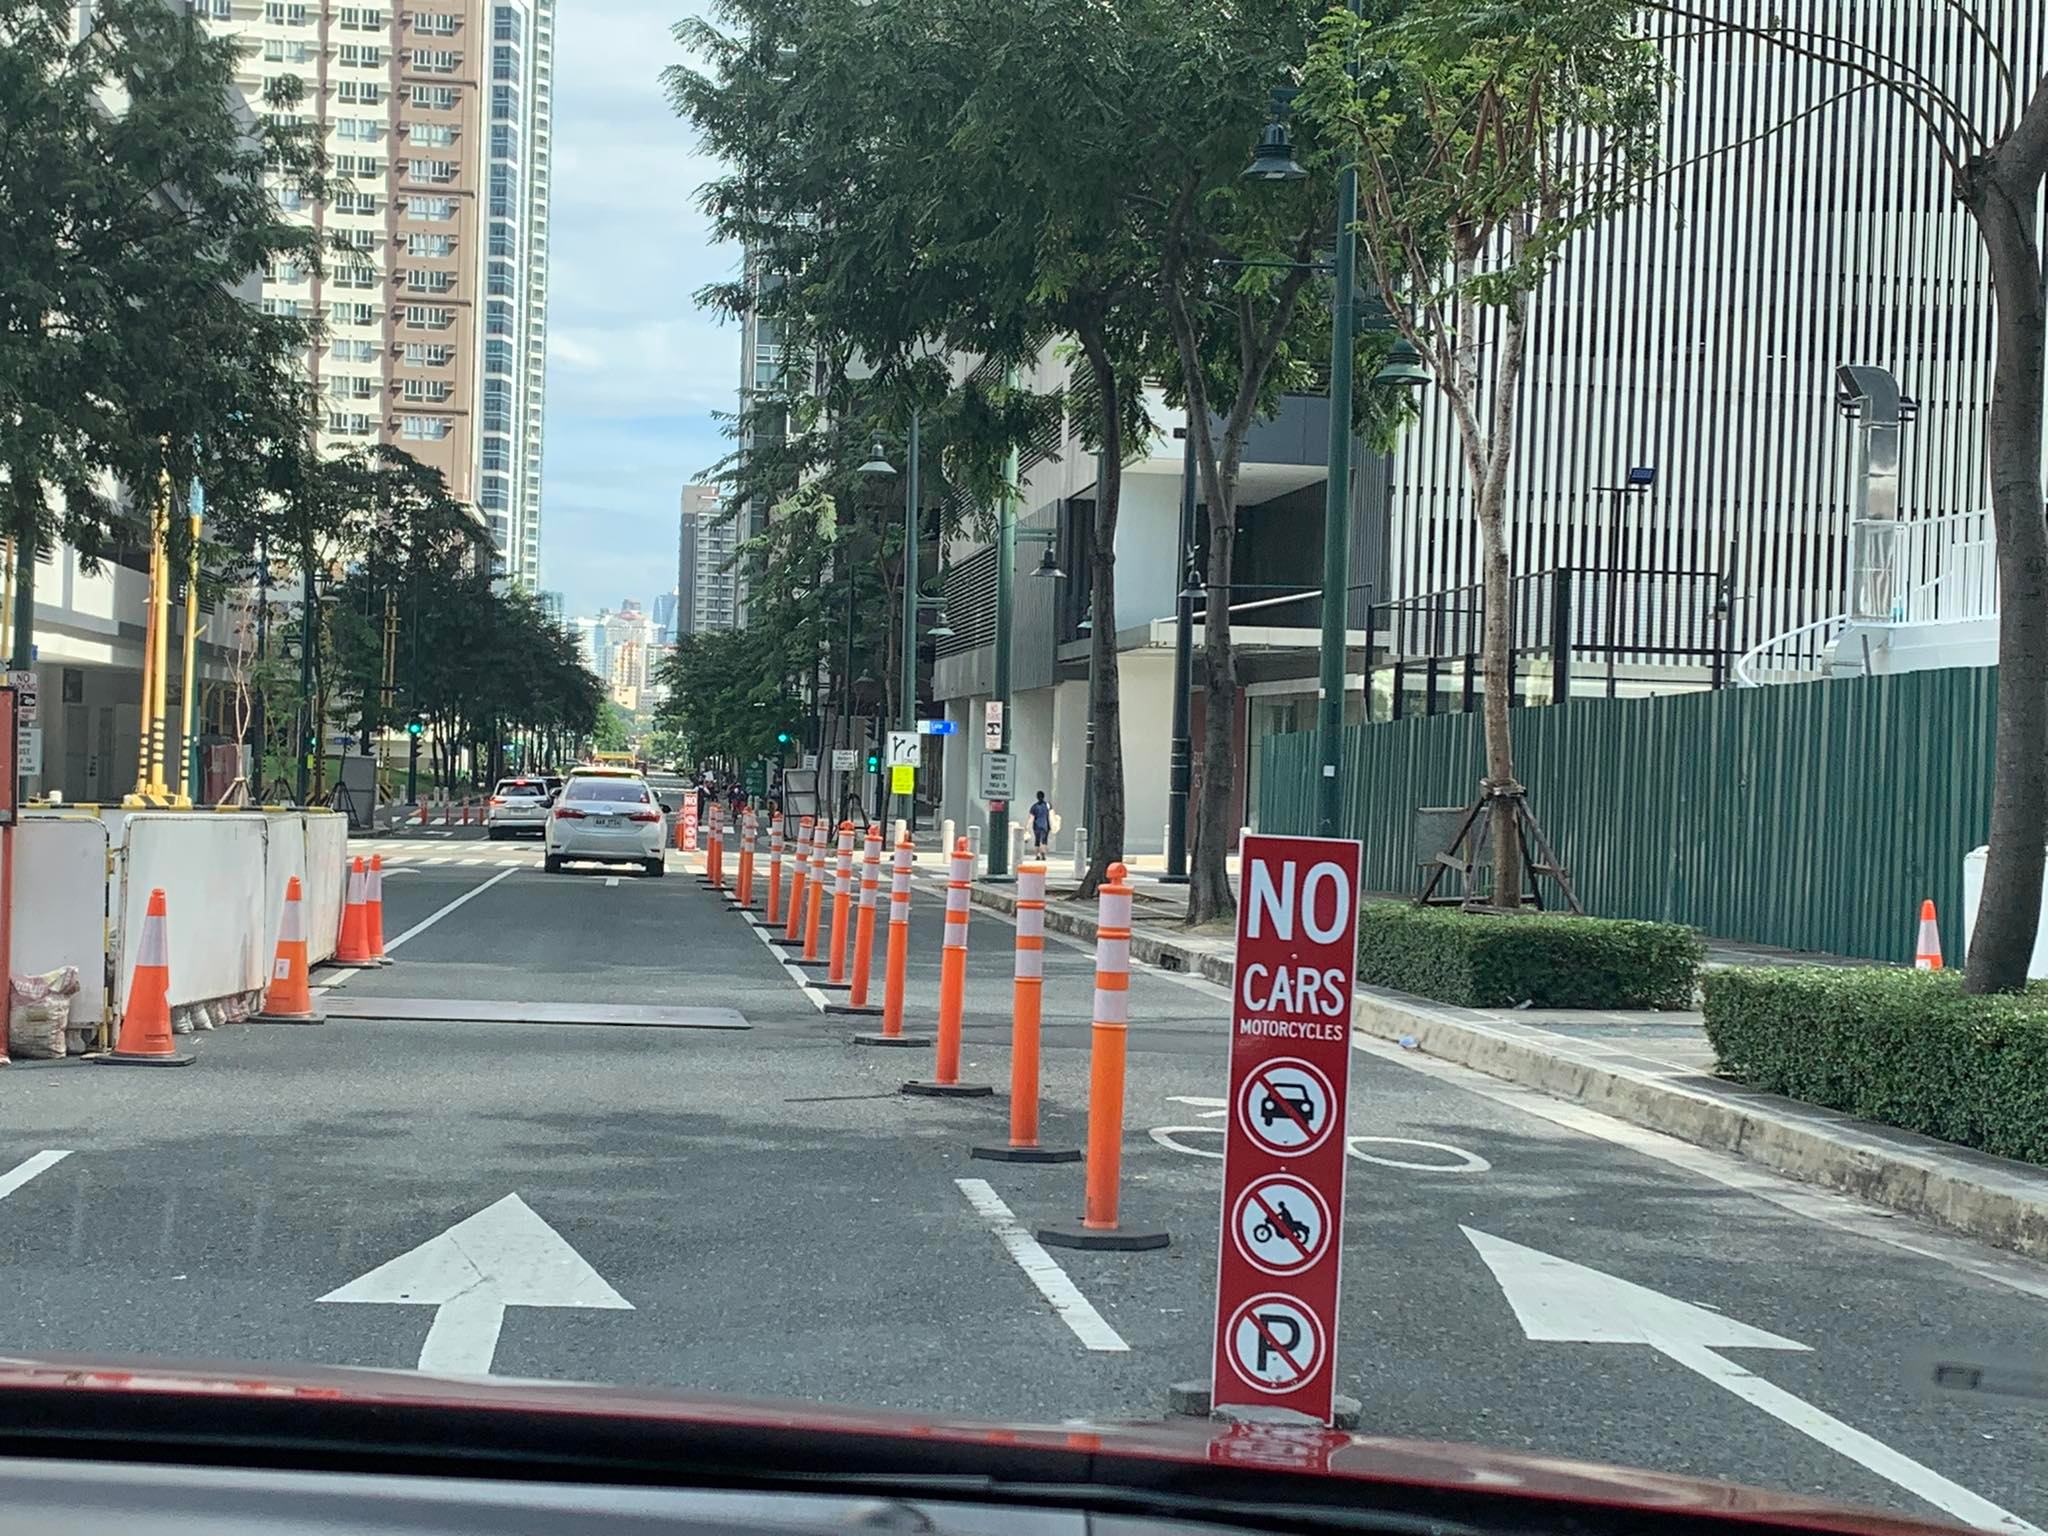
Bike lanes at BGC
We were at the Bonifacio Global City (BGC) a couple of weeks ago after almost two years of not going there mainly due to the pandemic. We frequented BGC before especially since my wife’s office is there and, if it weren’t for the ‘old normal’ traffic, the place offered a lot in terms of restaurants and shops. When traffic wasn’t as bad, we even had our Saturdays there with our daughter as her Kindermusik sessions were originally there before we transferred to their branch at The Grove. It’s not yet post-pandemic but traffic is back to ‘old normal’ levels.
I was expecting to see the bike lanes along C5 and at BGC when we traveled there. I will post separately about the bike lanes along C5. I just wanted to share here a few photos the wife took of the bike lanes at BGC. It is truly a welcome development not just here but in many places across the country where cycling offers another option for trips of various purposes including commuting between homes and workplaces. The protected lanes along 9th Avenue are wide and can be replicated elsewhere in order to encourage more people to use bicycles. The connectivity of bike lanes, though, leaves much to be desired if one expects people to use bikes for longer trips.


–
On the key transformations needed to achieve sustainable, low carbon transport
Also related to COP26, I am sharing material from the Sustainable Low Carbon Transport (SLOCAT) partnership, of which our center is part of. SLOCAT recently released the 11 key transformations for sustainable low carbon land transport urgently needed to meet the climate targets. Here’s a link to their site:
SLOCAT also has the following Wheel of Transport and the Sustainable Development Goals (SDG’s) on the same site. The Wheel illustrates the four cross-cutting themes: equitable, healthy, resilient and green.
In the SLOCAT site, they list the following to support the transformations:
Overarching approaches to apply across transport modes and sub-sectors overtime
- Put people first, not vehicles and technology
- Co-create and communicate a compelling vision and targets
- Guide short- and medium-term action with clear, coherent political messages
- Combine push and pull measures: Regulate and incentivise
- Link policies within and beyond transport for synergies
- Prioritise resources by social and sustainable value for money
- Engage, empower and coordinate stakeholders across government levels and sectors
- Build capacity and improve data
- Implement pilots to learn and share, then roll out at scale
–
On defining the 15-minute city
I have shared articles and briefly written about the concept of the 15-minute city on this blog. Here is another discussing how a 15-minute city is defined:
(February 8, 2021) “Defining the 15-minute city,” Public Square, https://www.cnu.org/publicsquare/2021/02/08/defining-15-minute-city [Last accessed: 8/10/2021]
Here is an image from the article:
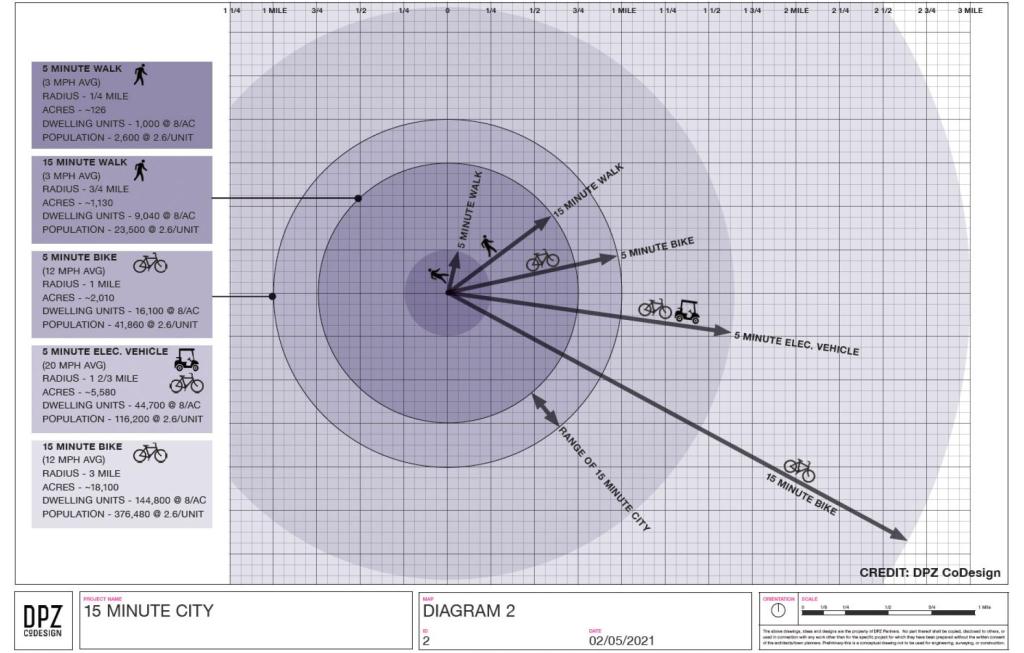
Again, it is important to contextualize these concepts. I share these as references and topics for discussion. Of course, I have my own opinions about this and I have written about those in previous posts. I guess in the Philippine context, we can include the pedicab or non-motorized three-wheelers in the discussion. These are also very popular modes in many cities and municipalities despite their being also prohibited along national roads like their motorized counterparts. It would be nice to have more visuals in the form of maps that show travel times for essential destinations or places like hospitals, markets, grocery stores, workplaces and, of course, homes. I assume there is at least someone, somewhere who perhaps have made multi-layer maps of this sort and attempted to related them along the lines of this concept of a 15-minute city (or perhaps the even older “compact cities”).
–
On quantifying the benefits of bike share
I’m sharing another article that presents a quantification of Such articles and studies are gaining interest as cycling or biking becomes a popular choice for many seeking an alternative to their usual or former modes of transport. It helps that there are many initiatives promoting active transport in general and cycling/biking in particular.
Wilson, K. (July 23, 2021) “Study: Bike Share Saves the U.S. $36 Million Public Health Dollars Every Year,” StreetsBlog USA, https://usa.streetsblog.org/2021/07/23/study-bike-share-saves-the-u-s-36-million-public-health-dollars-every-year/ [Last accessed: 8/6/2021]
While the article is about bike share, the conclusions can be extended to cycling/biking in general. The article points to at least 3 major areas where benefits can be derived: safety, air pollution (reduction) and physical activity. To quote:
“I think the message to cities is that bike share — and biking in general, though that’s harder to quantify in the way we do in this study — can contribute a lot to their long term goals,… Most cities want to improve quality of life, the economy, the climate, and their public health outcomes. Bike share does all those things.”
–
On the other benefits of cycling – pavements
Here is a very interesting article that tackles a not so obvious benefit of switching to cycling:
Dion, R. (July 12, 2021) “Biking’s Billion-Dollar Value, Right Under Our Wheels,” Planetizen, https://www.planetizen.com/features/113986-bikings-billion-dollar-value-right-under-our-wheels?utm_source=newswire&utm_medium=email&utm_campaign=news-07262021&mc_cid=51555c9a39&mc_eid=9ccfe464b1 [Last accessed: 8/4/2021]
To quote: “A strategic switch to biking would dramatically reduce the depth of roads, saving untold billions over the next generation.”
This is relevant from the perspective of highway engineering particularly concerning pavement design, construction and maintenance. It is intriguing, too, since pavement design (and consequently pavement thickness) is not necessarily correspondent to light vehicle traffic volumes. In the Philippines, for example, only heavy vehicles are considered for the pavement load estimation. It is assumed that light vehicle traffic, which compose most of the traffic along roads contribute mainly to pavement weathering rather than structural aspects.
–
Sharing an article on the benefits of cycling exercise
Here is another quick share of an article on the benefits of cycling. The article is more about the health benefits that are highlighted here with a study on diabetics:
Putka, S. (July 26, 2021) “One type of exercise reliably lowers your risk of death, says scientists,” Inverse, https://www.inverse.com/mind-body/benefits-of-cycling-exercise [Last accessed: 7/28/2021]
The article is clear about the impacts not being limited to diabetics or those with other illnesses. Also, while intensity and duration of exercise are mentioned and appear to have the most significant positive effects, the findings extend to relatively healthy people as well as those into lower intensity, less duration exercise. The key is still to be active. Of course, a healthy diet should also be a constant across these cases.
On riders’ perception of safety
The Federal Highway Administration (FHWA) of the US Department of Transportation released some infographics recently to highlight road safety. One very timely and relevant graphic image asks about which facilities make bicycle riders feel safer:

There were some initial reactions when I shared this on social media with one immediately criticizing share-use paths and citing the one along Marcos Highway (stretch under Pasig, Marikina, Cainta and Antipolo) as an example. I quickly explained that the graphic assumes good designs instead of the flawed one along Marcos Highway. In fact, the shared use path is also quite popular in Europe and particularly in the Netherlands where they have many examples of these paths stretching for kilometers that are exclusive to active transport (pedestrians and cyclists). The good designs need to be shared and circulated so people will know about what they look like and learn about their features. These can be adopted and adapted to local situations.
Did you notice the images of cyclists/riders at the top of the graphic? These are important, too, because they provide context in terms of the type of riders who are the targets for infrastructure and campaigns that support and promote cycling across different types of people. Cycling shouldn’t just be for the most fit or the weekend warriors but rather for everyone who could take it up and not just for recreation but for everyday, utilitarian use (e.g., commuting, shopping, etc.).
