
Home » Cycling (Page 2)
Category Archives: Cycling
On mountain biking and its history
Here is another quick share of a rather informative and amusing article about cycling, particularly about mountain-biking:
Septer, Q. (June 29, 2024) “The Poetry of Cycling,” Medium.com, https://medium.com/the-new-outdoors/the-poetry-of-cycling-dffeb752b510 [Last accessed: 8/24/2024]
To quote from the article:
“Mountain biking continues to ascend in popularity. New trails are built. New records are set. New technologies are fine-tuned to the subtleties of the sport’s sub-disciplines. But the ethos of mountain biking hasn’t changed all that much since the days of the Buffalo Soldiers, more than a century ago, when folks simply wondered how far a bicycle might take them.”
–
On a city’s part in making bike and scooter shares succeed
I recently posted about Bonifacio Global City (BGC) and the bike and scooter share they have there. There was one bike share there and in the Ortigas Center before the pandemic. But those fizzled out for various reasons including not so many people using it. Here’s a report on bike and scooter shares in the US and the observation that cities are not making it easy for these to succeed:
Tu, M. (July 29, 2024) “Report: People Want to Ride Shared Bikes and Scooters, But Cities aren’t Making it Easy,” Next City [Last accessed: 8/2/2024]
To quote from the article:
“Even long standing bike share systems can fall victim to the whims of leaders who are not committed to investing in greener modes of transportation. Houston recently lost its bike share system, ending 12 years of operations for BCycle after a new mayor hostile to bike and pedestrian improvements overhauled the METRO Houston board.
If cities want to encourage people to ride a bike or scooter instead of getting into a car, they will have to figure out how to fund it — or in other words, put their money where their carbon reduction goals are.”
Though we’re still a long way to achieving the bike and scooter shares they have in other countries such as the US, we should be wary about their experiences. The lessons learned here should already be in mind to those who will be setting up bike and/or scooter shares in Philippine cities. There is a demand for these facilities as people find cycling convenient and safer in some cities. However, LGUs need to invest more and commit to safer and more connected bicycle facilities in order to convince more people to use this active transport mode instead of motorized transport including motorcycle taxis.
–
SPRINT principles for bicycles
Here is the link to how to improve your city’s or municipality’s bicycle facilities based on scores guided by the SPRINT principles: https://cityratings.peopleforbikes.org/create-great-places
SPRINT stands for:
S -Safe Speeds
P-Protected Bike Lanes
R-Reallocated Space
I-Intersection Treatments
N-Network Connections
T-Trusted Data
The site provides links and examples of good practices of actual bike projects in the US. Many of these can be replicated or adapted to Philippine conditions. These are something that the active transport section of the Department of Transportation (DOTr) should look into and perhaps provide a reference for developing and improving bicycle facilities in the country.
–
On a ‘tipping point’ for bikeability in cities
Here’s a nice article on bikeability and pertains to cities in the United States that developed bikeways or bike lanes during the pandemic. Like many cities that have ‘discovered’ cycling as a viable mode of transport particularly for commuting during the COVID-19 pandemic, it is postulated that there would be a threshold when people would switch to cycling and/or demand for more cycling facilities.
Wilson, K. (June 25, 2024) “Has Your City Passed the ‘Bikeability Tipping Point’?,” StreetsBlog USA, https://usa.streetsblog.org/2024/06/25/has-your-city-passed-the-bikeability-tipping-point [Last accessed: 7/2/2024]
To quote from the article:
“A whopping 183 American communities achieved a score of 50 or higher on PeopleForBikes annual City Ratings this year, up from just 33 in 2019. The means 183 communities have scored at least half of the available points on the group’s signature “SPRINT” rubric that includes such measures as protected bike lanes, safe intersection treatments, and reduced speed limits that are unlikely to kill a cyclist in the event of a crash, among other factors.
And when a city clears that 50-point threshold, the authors of the ratings say that its local bike culture has firmly taken root — and that every new roadway improvement will inspire more improvements, rather than a fierce fight against a car-dominated status quo.
“Once you’ve hit 50, your city probably has a pretty good low-stress bike network,” said Martina Haggerty, the senior director of local innovation at PeopleForBikes. “[That’s] not to say that there aren’t still improvements to be made [but it] probably means that more people are riding bikes in those communities because they feel safe and comfortable. And when more people start riding bikes, those people tend to become advocates for better bike infrastructure and for pro-bike policies, which, [in turn,] will get more people riding.”
There are many links found in the article itself that are “click worthy”. I recommend the reader to explore the rubric from PeopleForBikes and see for yourself how this can be adopted for your city. Is such a rubric applicable to the Philippines? Perhaps, but there would be a need to assess the the situation in each city or municipality. So far, there have been mixed reviews among cities, especially those that appeared to have been more progressive and were more aggressive than others in putting up bicycle facilities including bike lanes. Perhaps the rubric can be applied to see how our LGUs measure up?
–
On the impact of bike lanes on motor vehicle traffic
With the news that bike lanes will be removed along major roads including, most recently, I share some findings from the US about a decrease in traffic speeds when there are protected bike lanes. The decrease in speeds are associated with a reduction in road crashes, ergo safer streets.
McPherson, K. (June 3, 2024) “Traffic Speeds Decrease When Bike Lane is Present,” Rutgers.edu, https://www.rutgers.edu/news/traffic-speeds-decrease-when-bike-lane-present [Last accessed: 6/8/2024]
To quote from the article:
“They found that the presence of the delineated bike lane made a difference: a 28 percent reduction in average maximum speeds and a 21 percent decrease in average speeds for vehicles turning right. For those heading straight and not turning, a smaller speed reduction of 8 percent was observed. In addition, drivers moving at a perpendicular angle to the bike lane did not slow down.
Marking the bike lanes with cones as a clearly delineated space was more effective at reducing speed than a painted-only bike lane. The painted-only bike lane was associated with a smaller speed reduction of between 11 percent and 15 percent, but only for drivers turning right.
Younes hypothesized that drivers slow down when they see a bike lane marked with the cones because the driving lane is narrower and requires more concentration, and it’s easier to notice cones or planters or some other space delineator than it is to spot painted lines on the road surface.”
Of course, one major element that was probably not considered in their studies is the presence and behavior of motorcycle riders. Motorcycles here frequently enter and use bike lanes whether protected or not. Often they crowd out bicycle users leading to situations where riders of motorized and non-motorized 2-wheelers come into conflict. Still, it would be nice to have a study to determine not just whether there are similar outcomes here but to what extent as well as how motorcycles figure in the study.
–
Another roadblock for active transport?
The Metro Manila Development Authority (MMDA) recently released what they claim to be their counts of bicycle traffic along major roads in Metro Manila from 2020 to 2023.
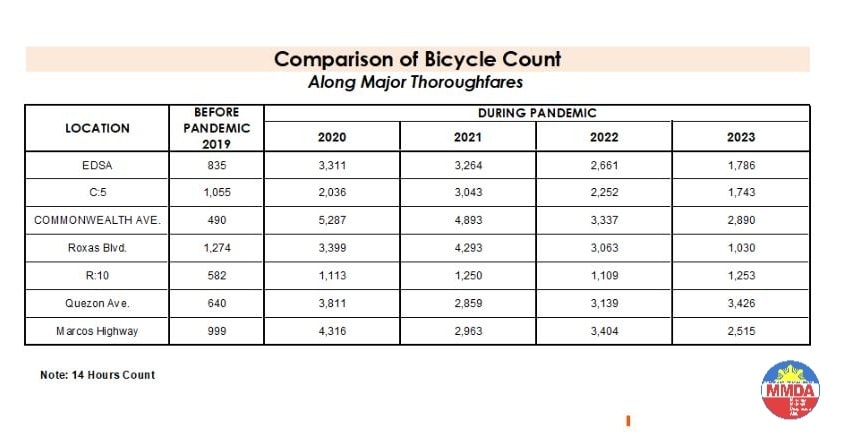
These are supposed to be official data as it is issued by the government agency in-charge of traffic management for Metro Manila roads (aside from its other functions and roles). What are not stated, and are actually very important details, are the locations of the counts and when the counts were conducted. The Traffic Engineering Center (TEC) that was under the DPWH and currently with the MMDA used to publish traffic volume maps for major roads in Metro Manila. So along EDSA, for example, the volume per section are shown on the map. The same for other major roads like Commonwealth, Quezon Avenue and SLEX. The thicker lines mean higher volumes along those sections, and vice versa. However, they did not consciously count bicycles (only motor vehicles) and perhaps MMDA only started counting during the pandemic (i.e., 2020). So there is no one value to represent a road. And counts vary over time of day, day of the week and even throughout the year (i.e., monthly variations).
There were many reactions to the MMDA’s posting of the data and most were critical and even derided the agency for what to them appeared to be inaccurate data. The problem is that it seems there are no other counts that can validate and perhaps refute the MMDA data. Previous bike counts were not conducted according to how the MMDA and DPWH count vehicles. That is, counts are typically done over a 14 or 16-hour period and ideally on several days in a year. Expansion and conversion factors are applied based on established stations along major roads that are supposed to have more frequent if not continuous counts. This methodology is how Annual Average Daily Traffic (AADT) is computed. Call it car-centric if you like but the methodology is very much applicable to bicycles as well. Peak hour counts for bikes are not enough and the peak hour factor for motor vehicles does not apply to bicycles (if this is to be used to expand/convert peak volumes to daily values). In fact, if you go into the math, there should be a peak hour factor for each type of vehicle considering each vehicle’s volume will vary differently over time. So yes, the solution here is to conduct bicycle counts according to how MMDA or DPWH counts vehicles and these should be done along several stations along major roads (e.g., those in the table above) to validate the MMDA counts.
More on this topic in the next post!
–
A risky mode choice – recumbent bike
I spotted this cyclist along Ortigas Avenue Extension. He would be hard to notice considering how low the vehicle is and his position astride the bicycle.
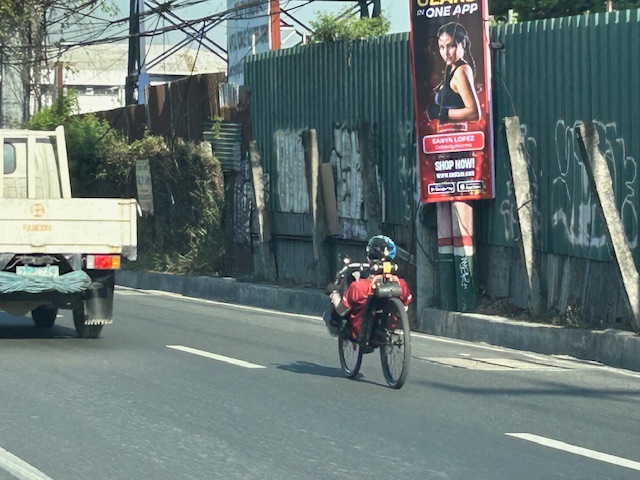 Man on a recumbent bike probably on his daily commute. Note the bike and its rider as compared with the small truck.
The problem is concerning his visibility to regular or typical road users. He might not be visible for the larger vehicles like trucks and buses, even jeepneys and vans whose drivers may be distracted by other vehicles in the traffic mix.
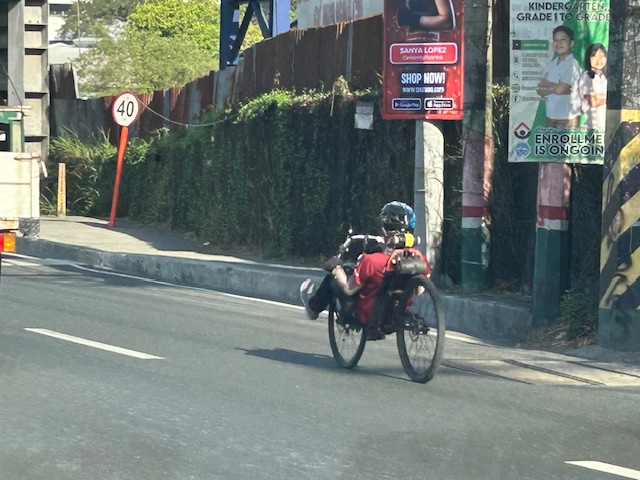
 Comparison with a typical cyclist, who is quite visible as shown in the photo
–
More than just painted lines – good practice examples of bike lanes
I’m sharing this article on the best bike lanes in the United States:
Holbrook, A. (February 12, 2024) “The 5 Principles That Make America’s Best Bike Lanes: A Lot More Than Painted Lines,” Velo, https://velo.outsideonline.com/urban/urban-gear/five-principles-the-best-bike-lanes/ [Last accessed: 2/15/2024]
This is a follow-up on an article on the best new bike lanes or bikeways that I shared earlier. This article features an interview of the author of the previous article about what features distinguish these bike lanes over others that have been implemented. Definitely, bike lanes should be designed beyond the usually painted lines that offer little protection to cyclists.
Here are examples of bike lanes in the Philippines:
 Painted bike lanes along Ortigas Avenue Extension, Cainta, Rizal
 Protected bike lane along Katipunan Avenue (C-5), Quezon City
–
On bike lanes network development – examples in the US
I am sharing this article on the best new bike lanes in the United States:
Haggerty, M. (January 12, 2024) “The Best New U.S. Bike Lanes of 2023,” People for Bikes, https://www.peopleforbikes.org/news/the-best-new-u.s.-bike-lanes-of-2023 [Last accessed: 1/23/2024]
Quoting from the article:
“Even for the most ardent naysayers, it’s difficult to deny that the landscape of bicycling in America is transforming (although not as quickly as many of us would like to see). While we have yet to see any U.S. cities emerge with truly bold citywide plans for bike networks as we’ve seen in places like London, Paris, and Bogota, many are (slowly) beginning to envision a future where cycling takes center stage. Although there remains a substantial amount of work ahead of us to cultivate a safe and comfortable environment for people of all ages and abilities to ride bikes in the U.S., it’s well worth pausing to commemorate the significant infrastructure victories U.S. cities achieved in 2023.”
The quote above also applies to us in the Philippines where there are still few examples of safe and comfortable bike lanes. I shared the same article on my social media page asking aloud if there’s something like this in the Philippines. I am aware of the Mobility Awards but that’s supposed to cover everything on mobility and particularly walking and cycling. The list is about bike lanes and touches on the various designs (note that in the US, while there are federal guidelines, most if not all states and cities would have their own that they use for planning and design of bicycle facilities). It would be nice to have our cities develop guidelines while also referring to the minimum standards in the DPWH Guidelines. Of course, the challenge is to come up with good if not the best designs and not just comply with the minimum.
If there was an award for best new bike lanes in 2023, I think Quezon City will have several nominees and even win the award with one. Picture above is the bike lane along Katipunan Avenue/C5.
–
Solar road studs for Ortigas Avenue Extension bike lanes
The bike lanes along Ortigas Avenue Extension now have solar road studs for these to be more visible at night time or when it is dark. Following are photos of the bike lanes at night.
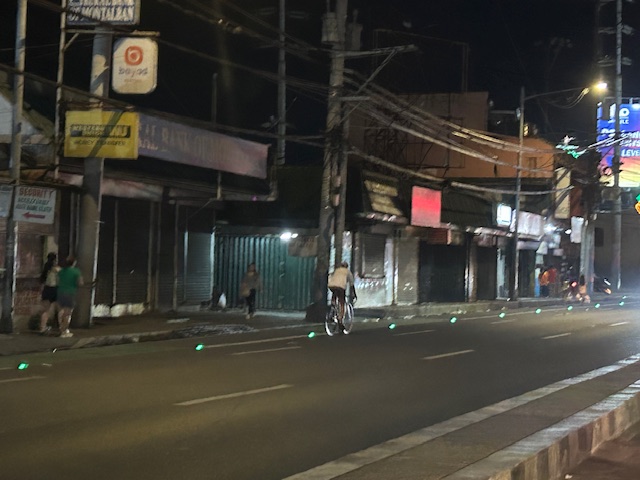
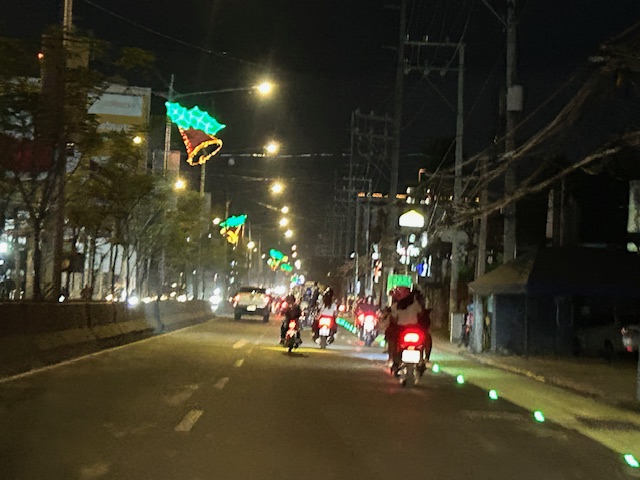
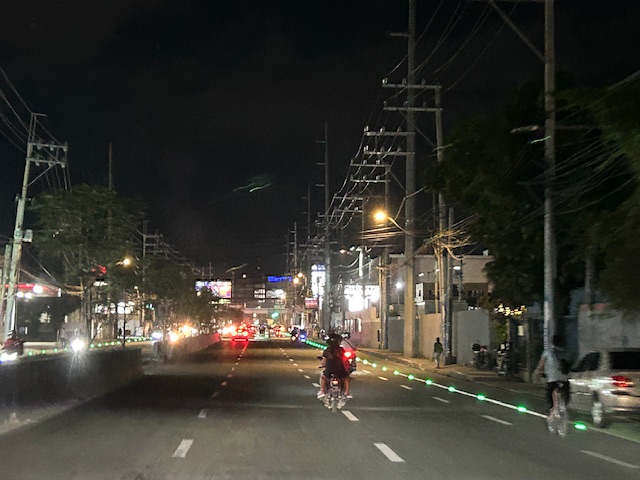
While the studs enhance the visibility of the bike lanes and perhaps also the safety of cyclists, the latter is not assured. The bike lanes are not protected and physical barriers like those installed along Quezon City roads are most effective in ensuring the safety of cyclists against motor vehicles. The solar studs do not deter motor vehicle drivers from encroaching on the bike lanes so they appear to have minimal impacts on safety.
–
