
Home » Mode Share (Page 4)
Category Archives: Mode Share
Increase in parking rates at NAIA
A friend shared this notice about the increase in parking rates at NAIA.
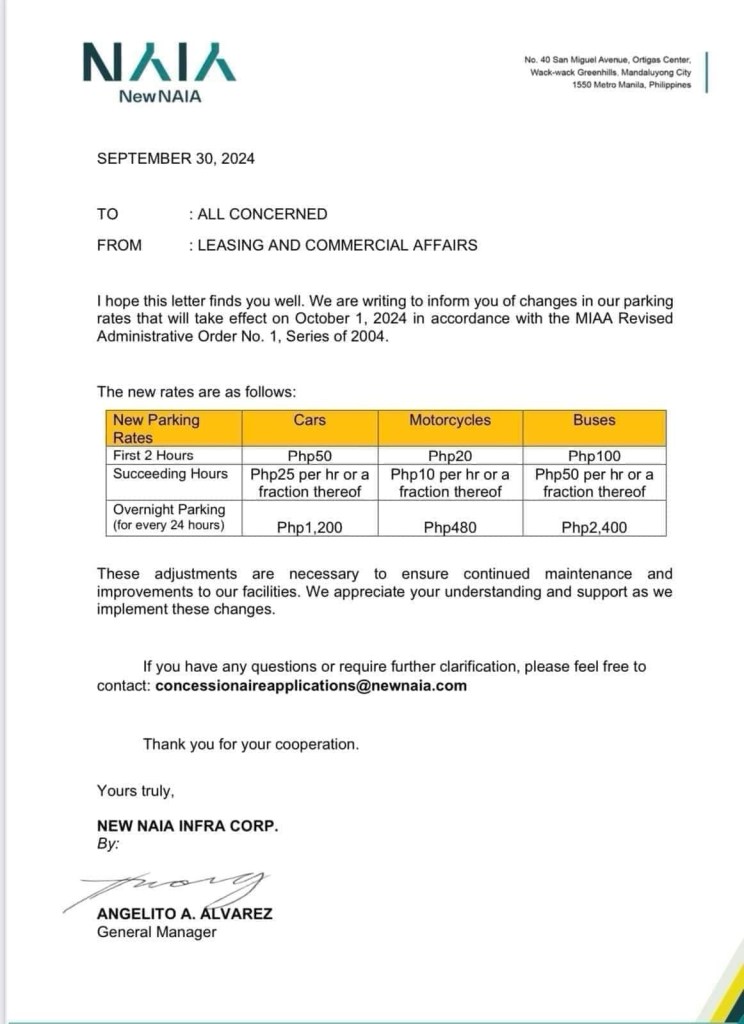
Parking at any of the terminals has been quite difficult if not horrendous. Everyone seems to be bringing their car to the airport for pick up and drop offs as well as leaving them for a night or more while traveling abroad or somewhere in the country. And then there are those who park there because the rates are supposed to be cheaper than the hotels and mall around the airport (e.g., the case of Terminal 3). Will the increase in the rates discourage unwanted or unnecessary parking? Perhaps not because people are still quite dependent on cars as their primary mode in and out of NAIA.
Access to the airport remains road-dependent. Granted there are many options like ride hailing, airport bus and taxis, these are all road based. They share the same roads that are often congested. The tollways are not enough to ease traffic in the area, which aside from airport generated trips include those from offices and industries in the area.
Too long has the need for a rail access for the terminals and government has failed to provide it. It would at least have engaged private sector for this provision but it took so long. Perhaps the Metro Manila subway will change that but we have to wait a long while to find out.
–
On congestion due to school drop-offs
I found this rather interesting article about congestion at school drop-offs in the US:
Hurley, K. (September 16, 2024) “How School Drop-Off Became a Nightmare,” The Atlantic, https://www.theatlantic.com/family/archive/2024/09/school-drop-off-cars-chaos/679869/?utm_source=copy-link&utm_medium=social&utm_campaign=share [Last accessed: 9/26/2024]
To quote from the article:
“Today, more parents in the United States drive kids to school than ever, making up more than 10 percent of rush-hour traffic. The result is mayhem that draws ire from many groups. For families, the long waits are at best a stressful time suck and at worst a work disruptor. Some city planners take the car line as proof of our failure to create the kind of people-centered neighborhoods families thrive in. Climate scientists might consider it a nitrogen-oxide-drenched environmental disaster. Scolds might rail at what they see as helicopter parents chaperoning their kids everywhere. Some pediatricians might point out the health threats: sedentary children breathing fumes or at risk of being hit by a car.”
The situation described in the article is actually already happening for quite a long time now in the Philippines and mostly at private schools. You have the same issues with the traffic congestion and road safety risks faced by schoolchildren in schools like Ateneo and LaSalle. The more ‘elite’ public schools like the science high schools may also have similar concerns. Can these be really addressed at the local level or is there a deeper, more complicated problem that needs to be tackled here (just to clarify that my questions are for our case here in the Philippines and not in the US)?
–
On ride hailing replacing more sustainable options for transport
We’ve long suspected that ride hailing or ride sharing is not as sustainable as their proponents and companies would project them to be. Here is more evidence showing how ride hailing has diminished other more sustainable transport options.
Kerlin, K. (August 28, 2024) “Half of Uber, Lyft Trips Replace More Sustainable Options,” UC Davis News, https://www.ucdavis.edu/news/half-uber-lyft-trips-replace-more-sustainable-options [Last accessed: 9/8/2024]
Quoting from the article:
“About 47% of the trips replaced a public transit, carpool, walking or cycling trip. An additional 5.8% of trips represented “induced travel,” meaning the person would not have made the trip were an Uber or Lyft unavailable. This suggests ride-hailing often tends to replace most sustainable transportation modes and leads to additional vehicle miles traveled. “
The article and the study by UC Davis is limited to their experiences with Uber and Lyft and perhaps others that employ cars. In our case, we have in addition motorcycle taxis or habal-habal that further takes away passengers from public and active transportation. Motorcycle taxis provide a very attractive alternative to conventional public transport modes as these are perceived to reduce travel times among other advantages they provide to users.
I will share some information later about the current mode shares in Metro Manila and how drastically public transport mode shares have been eroded post pandemic.
–
Technical sessions at the TSSP 2024 Conference
I am sharing here the latest draft of the technical sessions for the 30th Annual Conference of the Transportation Science Society of the Philippines (TSSP). The conference will be held in Iloilo City this coming September 13, 2024.
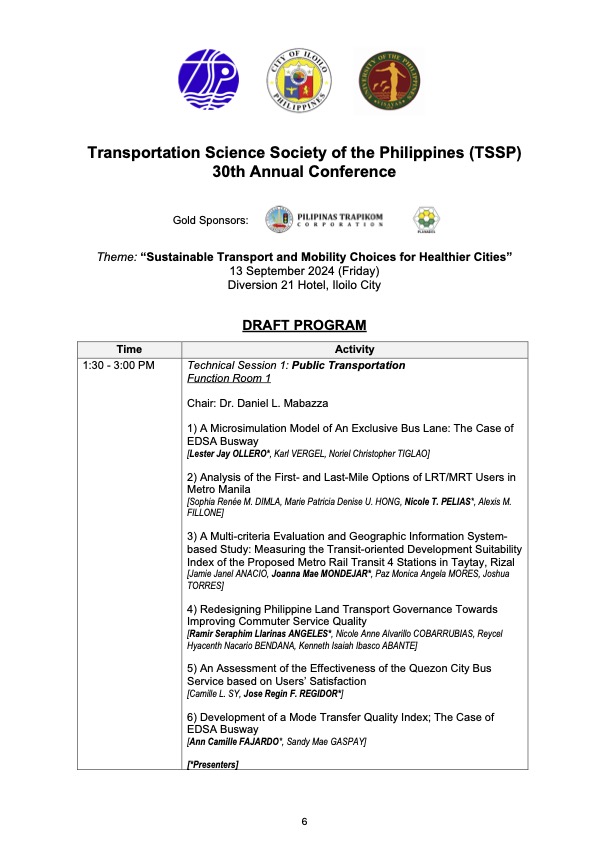
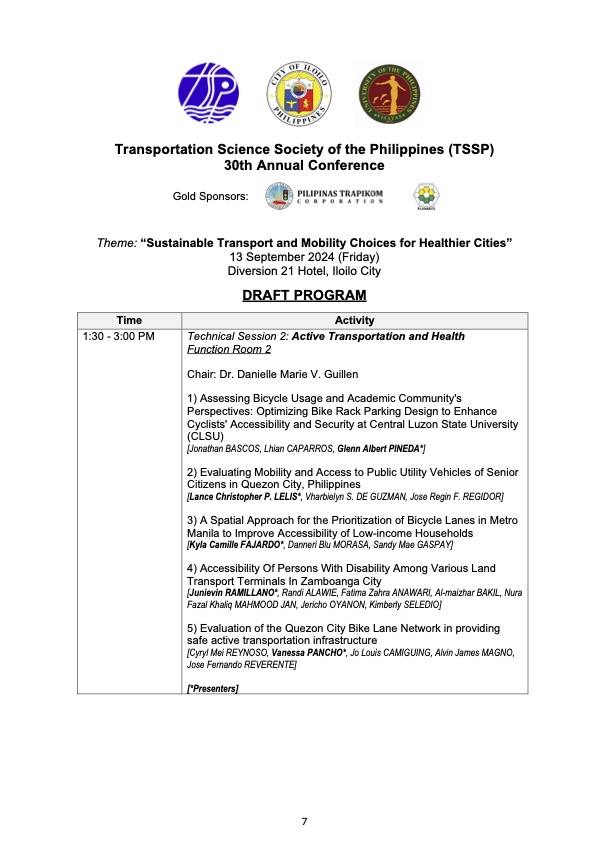
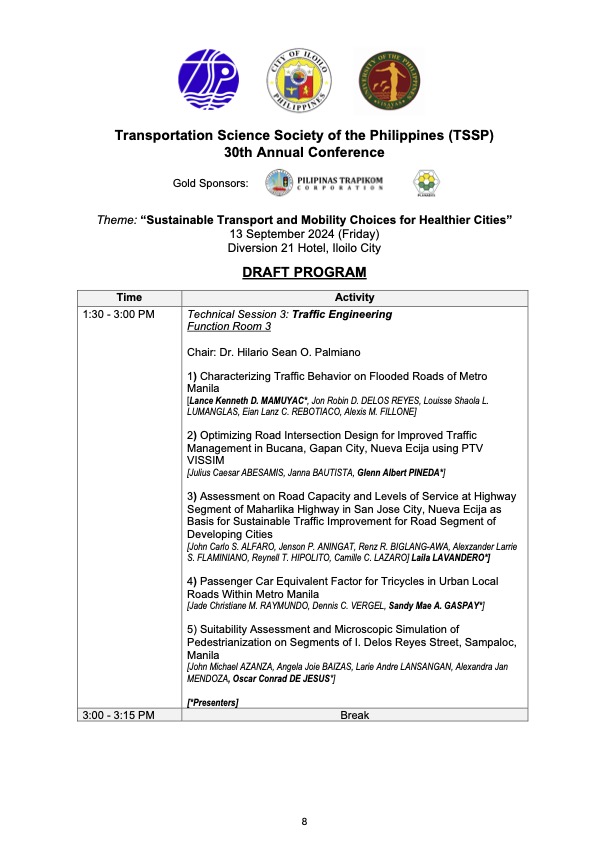
I will share the draft program for the morning plenary session in the next post.
–
Pedestrian-Friendly Cities: The Impact of Walkability Grants
Here is a quick share of an article on how to encourage cities to be more pedestrian-friendly:
Source: Pedestrian-Friendly Cities: The Impact of Walkability Grants
Many of our cities, particularly the highly urbanized ones, are not as walkable as we want them to be. Lacking are the most basic facilities such as sidewalks and safe crossings. Walkability Grants such as those in the US can encourage cities to build and/or enhance pedestrian infrastructure. Many designs such as those footbridges along EDSA and Commonwealth Avenue, for example, are anti-walking. Grants may be used to come up with better designs for walkways and footbridges.
To quote from the article:
“Walkability grants are awards for programs and projects creating innovative pedestrian infrastructure, such as new sidewalks, crosswalks, plazas, street lights and green spaces. For example, in February 2023, the Biden-Harris Administration announced the Safe Streets and Roads for All Grant Program, delivering $800 million in monetary awards for 511 projects addressing public safety and road improvements…
Reshaping the built environment into a walkable haven helps boost the local economy and sustainability. By changing the urban landscape, citizens are more inclined to walk instead of drive, allowing cities to reduce emissions, improve air quality and create healthier neighborhoods. This is critical, considering air pollution is responsible for 7 million early deaths yearly.”
Perhaps we can have similar grants coming from national government via the Department of Interior and Local Government (DILG) in cooperation with the Department of Transportation (DOTr) and the Department of Public Works and Highways (DPWH)? There was some funding for bikeways during the pandemic but this new one should put more emphasis on walkability.
–
On a city’s part in making bike and scooter shares succeed
I recently posted about Bonifacio Global City (BGC) and the bike and scooter share they have there. There was one bike share there and in the Ortigas Center before the pandemic. But those fizzled out for various reasons including not so many people using it. Here’s a report on bike and scooter shares in the US and the observation that cities are not making it easy for these to succeed:
Tu, M. (July 29, 2024) “Report: People Want to Ride Shared Bikes and Scooters, But Cities aren’t Making it Easy,” Next City [Last accessed: 8/2/2024]
To quote from the article:
“Even long standing bike share systems can fall victim to the whims of leaders who are not committed to investing in greener modes of transportation. Houston recently lost its bike share system, ending 12 years of operations for BCycle after a new mayor hostile to bike and pedestrian improvements overhauled the METRO Houston board.
If cities want to encourage people to ride a bike or scooter instead of getting into a car, they will have to figure out how to fund it — or in other words, put their money where their carbon reduction goals are.”
Though we’re still a long way to achieving the bike and scooter shares they have in other countries such as the US, we should be wary about their experiences. The lessons learned here should already be in mind to those who will be setting up bike and/or scooter shares in Philippine cities. There is a demand for these facilities as people find cycling convenient and safer in some cities. However, LGUs need to invest more and commit to safer and more connected bicycle facilities in order to convince more people to use this active transport mode instead of motorized transport including motorcycle taxis.
–
On a ‘tipping point’ for bikeability in cities
Here’s a nice article on bikeability and pertains to cities in the United States that developed bikeways or bike lanes during the pandemic. Like many cities that have ‘discovered’ cycling as a viable mode of transport particularly for commuting during the COVID-19 pandemic, it is postulated that there would be a threshold when people would switch to cycling and/or demand for more cycling facilities.
Wilson, K. (June 25, 2024) “Has Your City Passed the ‘Bikeability Tipping Point’?,” StreetsBlog USA, https://usa.streetsblog.org/2024/06/25/has-your-city-passed-the-bikeability-tipping-point [Last accessed: 7/2/2024]
To quote from the article:
“A whopping 183 American communities achieved a score of 50 or higher on PeopleForBikes annual City Ratings this year, up from just 33 in 2019. The means 183 communities have scored at least half of the available points on the group’s signature “SPRINT” rubric that includes such measures as protected bike lanes, safe intersection treatments, and reduced speed limits that are unlikely to kill a cyclist in the event of a crash, among other factors.
And when a city clears that 50-point threshold, the authors of the ratings say that its local bike culture has firmly taken root — and that every new roadway improvement will inspire more improvements, rather than a fierce fight against a car-dominated status quo.
“Once you’ve hit 50, your city probably has a pretty good low-stress bike network,” said Martina Haggerty, the senior director of local innovation at PeopleForBikes. “[That’s] not to say that there aren’t still improvements to be made [but it] probably means that more people are riding bikes in those communities because they feel safe and comfortable. And when more people start riding bikes, those people tend to become advocates for better bike infrastructure and for pro-bike policies, which, [in turn,] will get more people riding.”
There are many links found in the article itself that are “click worthy”. I recommend the reader to explore the rubric from PeopleForBikes and see for yourself how this can be adopted for your city. Is such a rubric applicable to the Philippines? Perhaps, but there would be a need to assess the the situation in each city or municipality. So far, there have been mixed reviews among cities, especially those that appeared to have been more progressive and were more aggressive than others in putting up bicycle facilities including bike lanes. Perhaps the rubric can be applied to see how our LGUs measure up?
–
On the idea of congestion pricing
I purposely titled this post to include the word ‘idea’ as congestion pricing is still very much like that in the Philippines. It is a reality in some part of the world particularly in Singapore where its Electronic Road Pricing (ERP) has evolved and improved over the years. Its success though seems to be an exceptional case that has not been replicated elsewhere where conditions are not exactly like the city state’s.
Here is an article that recently came out from The Washington Post about the New York Governor’s decision to backtrack on the proposed congestion pricing initiative in New York City:
McArdle, M. (June 12, 2024) “People hate traffic. They also hate this great idea to clear it,” The Washington Post, https://www.washingtonpost.com/opinions/2024/06/12/congestion-pricing-great-idea-people-hate/ [Last accessed: 6/14/2024]
To quote from the article:
“Roads are a scarce good; you can fit only so many cars on a road at one time, and fewer if you would like those cars to go somewhere. When roads are “free,” we are forced to fall back on a more costly and inefficient strategy: sitting in traffic. This wastes valuable human time and inflicts noise and pollution on everyone nearby. Far better to charge a modest price that inspires some drivers to carpool and others to take public transit or shop nearer to home, until supply and demand are balanced and traffic flows easily…
In political disputes, a discrete group facing highly concentrated costs often defeats a larger public interest that conveys a small individual benefit to everybody — such as being able to move around the city faster when you really need to. This is particularly true in the American system, which is designed to empower angry minorities. And it’s especially true when they’re abetted by status quo bias and a sympathetic majority, as in this case.
Complain all you want about selfish suburban drivers or the Metropolitan Transit Authority’s bloated cost structure or Hochul’s cowardice; the biggest obstacle to congestion pricing is that almost two-thirds of New York City residents have told pollsters they oppose it — in a city where less than half of all households even own a car. A more technocratic, less democratically responsive government might have been able to ram it through, and perhaps in time everyone would have come to like it. But in fractious America, with all its political veto points, congestion pricing is doomed by the reality that people hate slapping prices on things — especially if they have to pay them.”
There is a congestion pricing proposal in Baguio City and we don’t know yet how this will go. I don’t have the details yet except that a private company whose core business is tollways is involved. Will this be a model or a proof of concept? Or will it just go the way of a typical tollway where users are those who are willing to pay and which would eventually congest if most of the current users pay and use it anyway? Will the funds generated be used to develop a more efficient transport system for Baguio, eventually leading and contributing to less congested streets? That would also mean eventually less revenues from the congestion pricing scheme and probably lead to it being unnecessary.
–
Another roadblock for active transport?
The Metro Manila Development Authority (MMDA) recently released what they claim to be their counts of bicycle traffic along major roads in Metro Manila from 2020 to 2023.
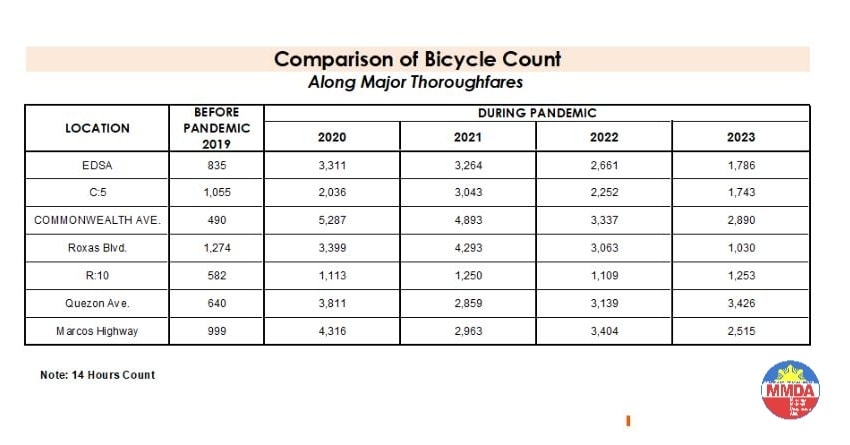
These are supposed to be official data as it is issued by the government agency in-charge of traffic management for Metro Manila roads (aside from its other functions and roles). What are not stated, and are actually very important details, are the locations of the counts and when the counts were conducted. The Traffic Engineering Center (TEC) that was under the DPWH and currently with the MMDA used to publish traffic volume maps for major roads in Metro Manila. So along EDSA, for example, the volume per section are shown on the map. The same for other major roads like Commonwealth, Quezon Avenue and SLEX. The thicker lines mean higher volumes along those sections, and vice versa. However, they did not consciously count bicycles (only motor vehicles) and perhaps MMDA only started counting during the pandemic (i.e., 2020). So there is no one value to represent a road. And counts vary over time of day, day of the week and even throughout the year (i.e., monthly variations).
There were many reactions to the MMDA’s posting of the data and most were critical and even derided the agency for what to them appeared to be inaccurate data. The problem is that it seems there are no other counts that can validate and perhaps refute the MMDA data. Previous bike counts were not conducted according to how the MMDA and DPWH count vehicles. That is, counts are typically done over a 14 or 16-hour period and ideally on several days in a year. Expansion and conversion factors are applied based on established stations along major roads that are supposed to have more frequent if not continuous counts. This methodology is how Annual Average Daily Traffic (AADT) is computed. Call it car-centric if you like but the methodology is very much applicable to bicycles as well. Peak hour counts for bikes are not enough and the peak hour factor for motor vehicles does not apply to bicycles (if this is to be used to expand/convert peak volumes to daily values). In fact, if you go into the math, there should be a peak hour factor for each type of vehicle considering each vehicle’s volume will vary differently over time. So yes, the solution here is to conduct bicycle counts according to how MMDA or DPWH counts vehicles and these should be done along several stations along major roads (e.g., those in the table above) to validate the MMDA counts.
More on this topic in the next post!
–
Article share: on making more affordable neighborhoods
I’ve been commenting about how transportation cannot be isolated and the need to relate it to other factors such as housing or home location choice. The latter though is also affected by other factors as well that affect the affordability of homes near the city centers or CBDs where workplaces and schools are located. The result of course is sprawl or the encouragement of sprawl. Private companies take advantage of this or contribute to this ‘encouragement’ by developing land farther away from the center. Thus, for Metro Manila’s case, many people reside in the peripheral provinces of Bulacan, Rizal, Laguna and Cavite. There are even those who choose to reside in Pampanga, Bataan and Batangas.
Kayatekin, C.S. and Sanmiguel, L.U. (April 16, 2024) ” ‘Urban form’ and the housing crisis: can streets and buildings make a neighborhood more affordable?” The Conversation, https://theconversation.com/urban-form-and-the-housing-crisis-can-streets-and-buildings-make-a-neighbourhood-more-affordable-224108 [Last accessed: 4/23/2024]
Quoting from the article:
“Our main finding was that the bottom-up districts we looked at had, overall, more small-scale apartments. The reason is simple: they had more small-scale buildings, built on small-scale plots. Once divided into apartments, this produces small apartments – homes in the bottom-up areas were 10% to 23.1% smaller than their top-down counterparts. This also made their real estate markets for small homes more competitive, and therefore more affordable.
However, our study showed there is nothing inherently magical about bottom-up areas. Their more intricate housing stock has little to do with the layout of streets and blocks, and a lot to do with how that land is built upon.
Plot size appears to be the deciding factor: the districts with greater numbers of small buildings built on small plots supported a denser and more affordable housing stock, regardless of whether they were top-down or bottom-up.
Older bottom-up areas seem to naturally lend themselves to having more small-scale plots. This is likely due to the incremental development of these areas, and the complex land ownership patterns that developed as a result. However, there is no reason why a top-down area cannot be designed to replicate these characteristics.”
–
