
Home » Mode Share (Page 5)
Category Archives: Mode Share
Another roadblock for active transport?
The Metro Manila Development Authority (MMDA) recently released what they claim to be their counts of bicycle traffic along major roads in Metro Manila from 2020 to 2023.
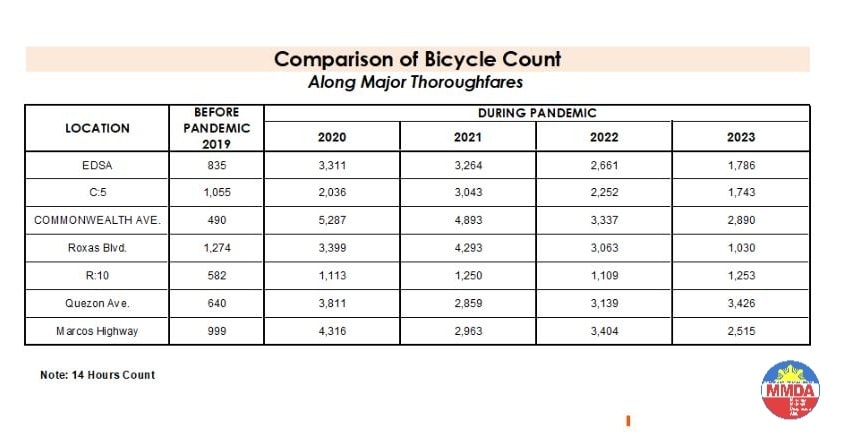
These are supposed to be official data as it is issued by the government agency in-charge of traffic management for Metro Manila roads (aside from its other functions and roles). What are not stated, and are actually very important details, are the locations of the counts and when the counts were conducted. The Traffic Engineering Center (TEC) that was under the DPWH and currently with the MMDA used to publish traffic volume maps for major roads in Metro Manila. So along EDSA, for example, the volume per section are shown on the map. The same for other major roads like Commonwealth, Quezon Avenue and SLEX. The thicker lines mean higher volumes along those sections, and vice versa. However, they did not consciously count bicycles (only motor vehicles) and perhaps MMDA only started counting during the pandemic (i.e., 2020). So there is no one value to represent a road. And counts vary over time of day, day of the week and even throughout the year (i.e., monthly variations).
There were many reactions to the MMDA’s posting of the data and most were critical and even derided the agency for what to them appeared to be inaccurate data. The problem is that it seems there are no other counts that can validate and perhaps refute the MMDA data. Previous bike counts were not conducted according to how the MMDA and DPWH count vehicles. That is, counts are typically done over a 14 or 16-hour period and ideally on several days in a year. Expansion and conversion factors are applied based on established stations along major roads that are supposed to have more frequent if not continuous counts. This methodology is how Annual Average Daily Traffic (AADT) is computed. Call it car-centric if you like but the methodology is very much applicable to bicycles as well. Peak hour counts for bikes are not enough and the peak hour factor for motor vehicles does not apply to bicycles (if this is to be used to expand/convert peak volumes to daily values). In fact, if you go into the math, there should be a peak hour factor for each type of vehicle considering each vehicle’s volume will vary differently over time. So yes, the solution here is to conduct bicycle counts according to how MMDA or DPWH counts vehicles and these should be done along several stations along major roads (e.g., those in the table above) to validate the MMDA counts.
More on this topic in the next post!
–
Article share: on making more affordable neighborhoods
I’ve been commenting about how transportation cannot be isolated and the need to relate it to other factors such as housing or home location choice. The latter though is also affected by other factors as well that affect the affordability of homes near the city centers or CBDs where workplaces and schools are located. The result of course is sprawl or the encouragement of sprawl. Private companies take advantage of this or contribute to this ‘encouragement’ by developing land farther away from the center. Thus, for Metro Manila’s case, many people reside in the peripheral provinces of Bulacan, Rizal, Laguna and Cavite. There are even those who choose to reside in Pampanga, Bataan and Batangas.
Kayatekin, C.S. and Sanmiguel, L.U. (April 16, 2024) ” ‘Urban form’ and the housing crisis: can streets and buildings make a neighborhood more affordable?” The Conversation, https://theconversation.com/urban-form-and-the-housing-crisis-can-streets-and-buildings-make-a-neighbourhood-more-affordable-224108 [Last accessed: 4/23/2024]
Quoting from the article:
“Our main finding was that the bottom-up districts we looked at had, overall, more small-scale apartments. The reason is simple: they had more small-scale buildings, built on small-scale plots. Once divided into apartments, this produces small apartments – homes in the bottom-up areas were 10% to 23.1% smaller than their top-down counterparts. This also made their real estate markets for small homes more competitive, and therefore more affordable.
However, our study showed there is nothing inherently magical about bottom-up areas. Their more intricate housing stock has little to do with the layout of streets and blocks, and a lot to do with how that land is built upon.
Plot size appears to be the deciding factor: the districts with greater numbers of small buildings built on small plots supported a denser and more affordable housing stock, regardless of whether they were top-down or bottom-up.
Older bottom-up areas seem to naturally lend themselves to having more small-scale plots. This is likely due to the incremental development of these areas, and the complex land ownership patterns that developed as a result. However, there is no reason why a top-down area cannot be designed to replicate these characteristics.”
–
When Driving Isn’t an Option: Steering Away From Car Dependency
Here is another quick share of an article from Planetizen. The article relates about people who cannot drive so driving for them is not an option:
Source: When Driving Isn’t an Option: Steering Away From Car Dependency
Quoting from the article:
“Zivarts shows that it is critical to include people who can’t drive in transportation planning decisions. She outlines steps that organizations can take to include and promote leadership of those who are most impacted—and too often excluded—by transportation systems designed by and run by people who can drive. “
There are actually many who can drive and who would like not to drive but then opt to drive because of limited and inconvenient or uncomfortable options. I think government agencies and local government units are supposed to work on this but like people who try to ‘solve’ traffic by isolating it from other factors such as housing, they ultimately gain little ground if not fail. It doesn’t help that the decision makers such as government officials and politicians drive or are driven. Of course, there is still such a thing as empathy so let’s not discount those who do use cars for their commutes but also work hard to improve transportation. It’s just that such people are rare these days and may not be in a position to move things to enable significant improvements to the transportation system.
–
Planning for Accessibility: Proximity is More Important than Mobility
Here is a quick share of another very informative article that discusses the importance of proximity and more dense development in order to reduce car dependence.
Source: Planning for Accessibility: Proximity is More Important than Mobility
Here are some excerpts from the article:
“This shows that proximity is much more important than mobility in providing accessibility: location, location, location. For the last century, our transportation planning practices have contradicted this principle. Transportation agencies built urban highways that destroyed and degraded accessible and multimodal neighborhoods to benefit suburban motorists. This was racist and classist, but the mechanism was the way that transportation planners valued increased traffic speeds, measured as travel time savings, while ignoring the loss of accessibility imposed on urban neighborhood residents.
Of course, many other factors affect people’s transportation and neighborhood preferences. Some people need their cars for work or after-work activities, and not everybody can bicycle or use transit even if it is available. However, surveys such as the National Association of Realtor’s National Community Preference Survey indicate that many people would prefer living in more compact, walkable neighborhoods than they currently do but cannot due to a lack of supply.”
Such articles are a must read for those who want to understand why government needs to invest in land at or near the CBDs, and develop that land so people will not need to reside far from their workplaces and schools. Truly, there are many other factors affecting transport preferences or mode choice. Housing is one such factor that we continue to treat separately from transport. It is very (prohibitively) expensive to buy or rent in the city particularly in or near the CBDs. The result is people opting to purchase or rent homes in the suburbs. It doesn’t help that developers are also actively promoting subdivisions there and therefore are contributing to sprawl that puts so much pressure on transportation systems.
–
Article share: on subsidies to public transportation
Here’s a nice article that presents arguments for subsidies to support transit or public transportation:
Wilson, K. (February 5, 2024) “Study: Subsidizing Transit Actually Makes It More Efficient,” Streets Blog USA, https://usa.streetsblog.org/2024/02/05/study-subsidizing-transit-actually-makes-it-more-efficient [Last accessed: 2/18/2024]
Subsidies to public transportation can be quite tricky and may require quite a balancing act. There seems to be few options outside of the straightforward subsidies national and local governments in the Philippines provide. Rail transit, for example, is heavily subsidized but these are rare for road-based public transportation. The concept of service contracting has been considered but it also has a few variations. While there seems to have been a proof of concept tested during the pandemic, it required so much funds that government apparently lost interest (i.e., the funds were also needed by other sectors). Local governments meanwhile, or at least those that had resources, decided to operate their own public transport (e.g., Quezon City bus).
To quote from the article:
“Newmark’s study doesn’t definitively determine why, exactly, high subsidies seem to correlate with better efficiency and transit agencies collecting more fares, but he has some theories. Some systems, he says, use subsidies to increase service frequency or install dedicated lanes to speed routes up along heavily-utilized corridors — and riders are responding, predictably, by showing up in droves. (Route expansion can help, too, he said, but only if agencies expand service to places “where there’s actual demand.”) Others use subsidies to keep ticket prices low, but not to eliminate fares outright, which Newmark argues is a smart move.
“People value stuff they pay for, and they pay for stuff they value,” Newmark added. “An underlying point in this paper is that transit offers something [valuable], and it’s worth trying to capture that value, whether through fares or in other ways.”
If transit networks and the taxpayers who support them can get that recipe right, it could create a virtuous cycle.
“If people see the benefits [of subsidies], that may make them more willing to invest [their taxpayer dollars],” he adds. “Good transit leads to a real social movement for more subsidies.” “
What do you think about subsidies to public transport in the Philippine setting? Of course, we are referring to ‘formal’ public transportation here. There are many ‘informal’ or paratransit modes like tricycles and non-motorized pedicabs. There are also motorcycle taxis providing services or filling in the gaps in transport services.
–
On the Pasig River esplanade project
My news feed was full of articles on the Pasig River esplanade, or at least the recently completed section at the Manila Central Post Office building. This is a proof of concept type of project that hopes to be expanded or extended to cover both sides of the river much like the Iloilo River Esplanade project. If you are wondering what the section looked like before the project, here are two posts I wrote in 2012 that features a lot of photos of the Muelle del Rio:
These were way before the fire that damaged the Post Office building. However, even at that time, there were already calls for the renovation, even repurposing of the Post Office building. Such projects or proposal draw inspiration from Singapore where old buildings have been preserved and many repurposed (e.g., how about the Post Office building transformed into a hotel?). Perhaps such will breathe life and lead to a revival of this part of Manila?
–
On micro transit covering for regular public transport services
I am sharing this very interesting (to me) article on microtransit making up for the conventional public transportation:
Zipper, D. (December 19, 2023) “On-Demand Microtransit Can’t Escape This Big Problem,” Bloomberg, https://www.bloomberg.com/news/articles/2023-12-19/the-inflexible-problem-with-flexible-microtransit?utm_source=website&utm_medium=share&utm_campaign=copy [Last accessed: 12/22/2023]
To quote from the article:
“Fixed-route service on large buses also offers the economies of scale that microtransit lacks. As long as empty bus seats are available, each new rider brings new revenue to the transit agency while incurring minimal added costs, thereby reducing the subsidy required for each trip. Public dollars can then be reallocated to expand service, which will make transit more useful, thus attracting more riders — and the virtuous cycle continues.
For microtransit, that flywheel effect is missing; the cost of service keeps rising as more people use it. “It would be great to have anywhere-to-anywhere connectivity for the price of transit,” said Goldwyn. ”But it’s just not possible.””
I think this article also touches on motorcycle taxis though perhaps there are also differences between the western and Asian contexts for micro mobility. Surely though, such transport modes cannot approximate transit capacities and require so many more vehicles (e.g., motorcycles) that probably means more chaos and compromised safety along our roads.
–
On walking and taking the stairs
With the increasing popularity of active transport, people still forget that biking is not the only mode being referred to by the term. Walking is the most basic form of transport for us and there are many creative ways to encourage walking even if it is indoors like in an office building, a school building or a shopping mall. Here is a photo of the stairs at one mall with encouraging words for those taking the stairs instead of the escalators or elevators. It only takes 30 minutes of walking everyday to gain the benefits of a more active lifestyle.

My daily walks take me up and down the hilly roads in our neighborhood. I attribute to these walks my relatively effortless climbs to the 4th floor of our school building where my office is. Our elevator has been out of commission for some time now so we are all forced to take the stairs to our lecture rooms and offices. These I refer to as ‘stairmaster’ exercises, which is included in my daily routine so it adds to my step count as well as being recorded for the flights of stairs I take each day. I attest to this routine to improving my health and well-being, and highly recommend this to those who are able to do so.
–
Incorporating bike lanes along local roads – an example in Taguig City
I have not used an old route that we usually take to go to BGC from our place in Antipolo. This is via the Manila East Road, Highway 2000, Barkadahan Bridge and C6. From C6, we usually take Ruhale instead of Seagull Avenue as the former provided a shorter route towards Levi Mariano Avenue and C5. So it was only last weekend that I was able to see the improvements along Ruhale Street and how bike lanes were incorporated along this road. I am sharing the following photos showing a two lane road and Class 2 bike lanes.
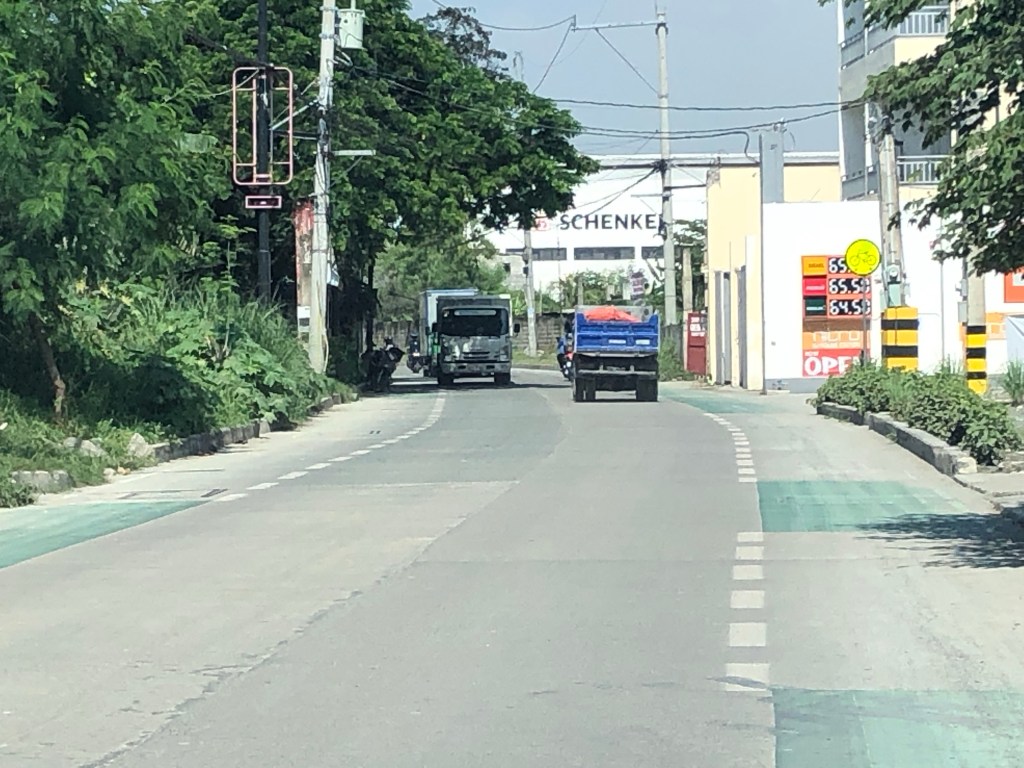 The green pavement markings indicate an intersection or driveway.
 Noticeable are the electric posts that remain along the bike lanes. These need to be transferred so they will not pose danger to all road users.
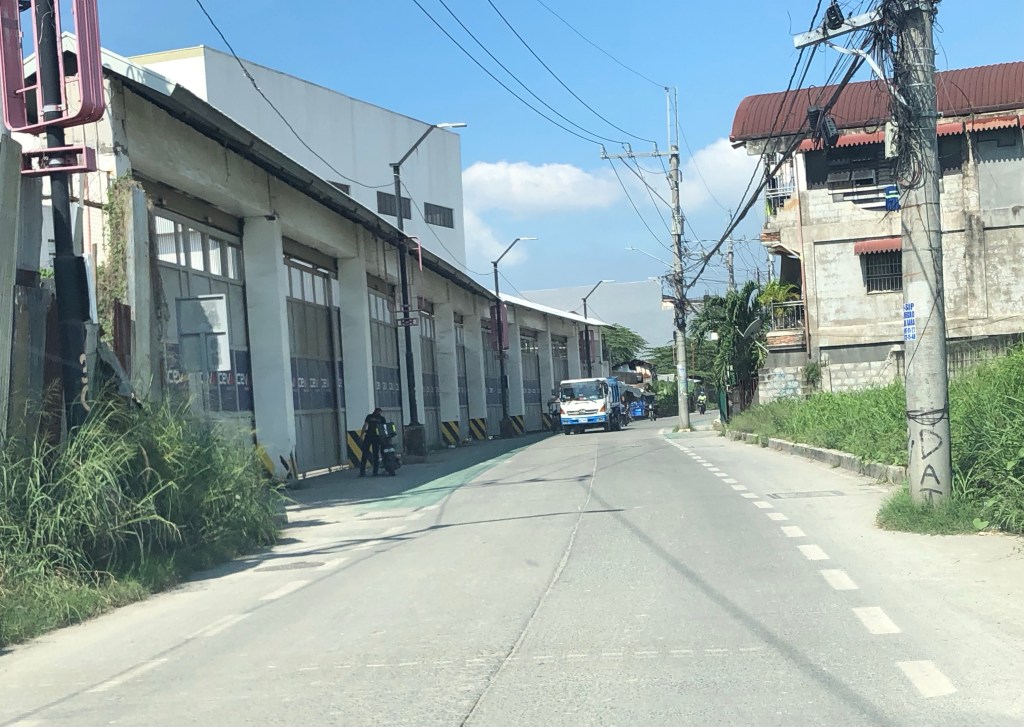 More electric posts along the bike lanes
 Bike lanes in front of an industrial establishment
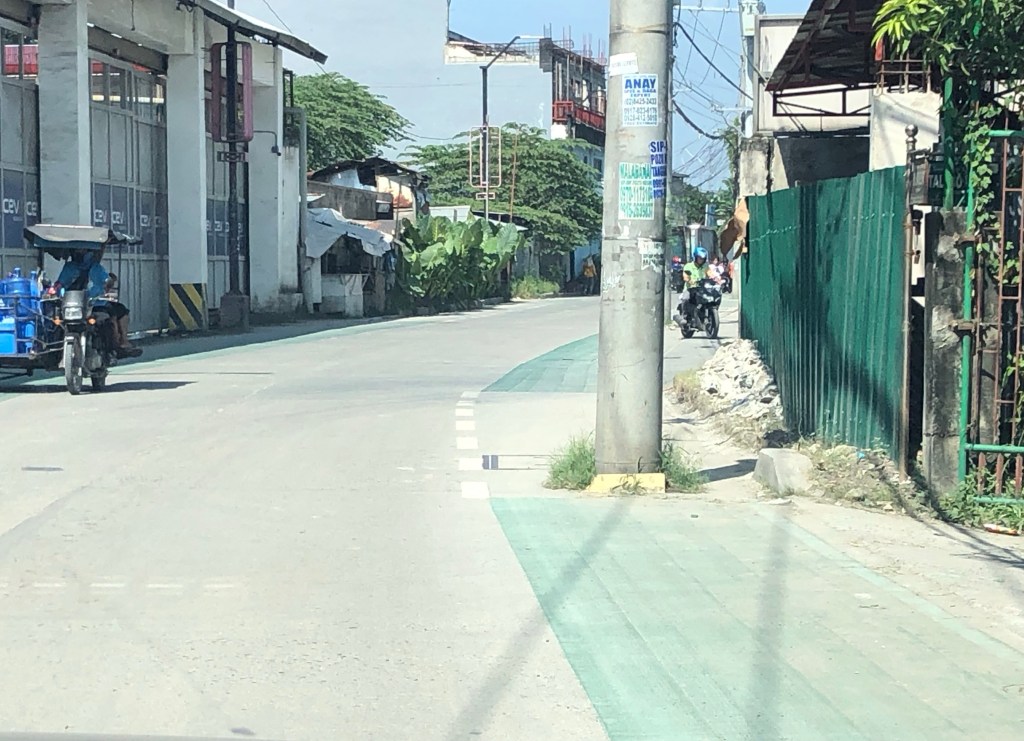 Close-up of a post in the middle of the bike lane.
 Bike lane across another industrial establishment. Again, note the green pavement marking across the driveway of the establishment.
 Bike lanes along a predominantly residential area along Ruhale.
I would consider this as a good practice example that can be replicated elsewhere. Of course, it is not perfect and as shown in the photos, there is much room for improvement including the transfer of electric posts that pose as hazards to all road users. The bike lanes are wide enough that installing bollards for the perception of physical protection vs. motor vehicles can be considered. Ruhale is generally a low speed, low volume road so perhaps the current state with no barriers would be enough for now. Also, we need to appreciate that these are already gains or wins in as far as active transport is concerned. A few years ago, this would not have been implemented by national or local governments.
–
Ownership is not equal to use – on bike ownership in the Philippines
There is a nice graphic going around social media about bicycle and vehicle ownership in the Philippines. It is attributed to the Social Weather Stations (SWS), which conducted a survey on vehicle ownership in the country during the first quarter of 2023. Most conspicuous is the inclusion of bicycles considering that past national surveys (especially those conducted by the PSA or NSA) did not include bicycles but only motor vehicles in their surveys.
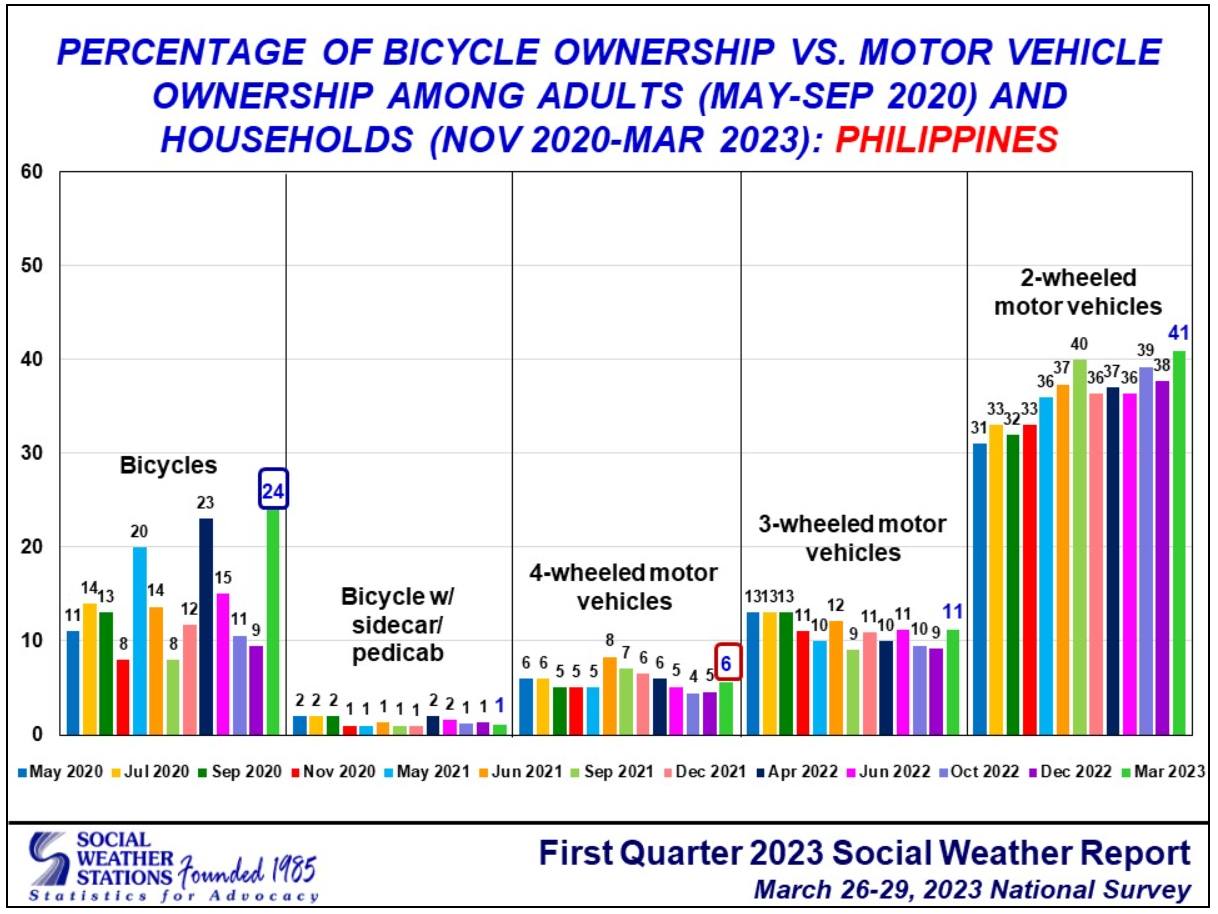
The graph shows many households owning bicycles (24% as of Mar 2023) while those who owned 4-wheel motor vehicles are only at 6%. The quick conclusion I see in many social media posts is that only 6% of HH use cars and that 24% use bicycles. This is actually fallacious and therefore misleading. Such assessments and conclusions is far from being factual considering ownership in this case does not necessarily translate to use, particularly for the most important trips made during the day – commutes to work and school. In other words, a household owning at least one bicycle does not mean they use it for their regular commutes.
The graph also states that the data is for the entire country. Thus, it does not give us a more accurate take for cities, particularly the highly urbanized ones. Are the % the same for cities like those in Metro Manila? How were the samplings conducted? These are important because if we have the wrong data and assumptions, we won’t be able to understand the problem at hand. We will not be able to formulate the most suitable solutions to address the transport problems we are experiencing. On the part of SWS, they should be clarifying what the data means rather than be content of people using their data to mislead or peddle narratives for advocacies that may be worthy yet use misinformation as a means to an end.
–

