
Home » Mode Share (Page 8)
Category Archives: Mode Share
On school bus services and the return to face-to-face classes
I did an interview last August with a major business daily but I couldn’t find it as published as part of an article. The topic was a very timely one as children return to schools for face-to-face (F2F) classes. Here are the questions sent to me and my responses as I remember them:
1. How will the transport sector cope with the expected increase in demand as more schools resume face-to-face classes?
For schools located in the cities, what we see is people opting to take private transportation in the form of cars or motorcycles to take their children to school. This is because public transportation supply is still not back to pre-pandemic levels while at the same time, parents and guardians and even students who commute by themselves (e.g., high school and college levels) may be hesitant to take public transportation as well as school service vehicles. The latter may be attributed to concerns about the safety particularly with regards to health (i.e., getting infected or exposed to Covid-19 if they take public transport or a vehicle where they share the ride with many other people). We need more public transportation capacity to be able to address the increased demand brought about by students coming back for face-to-face classes. We also need to have other options or alternatives for their safe journeys including walking and cycling for their commutes.
For schools in the rural areas, there may be little adjustment concerning transport since most schoolchildren walk or take motorcycles or tricycles to school. This is perhaps because most schoolchildren reside within the school district and do not have long commutes like what we have in many cities (e.g., most schoolchildren who study at schools like Ateneo, LaSalle, etc. likely live in another city or town rather than near the schools).
2. How many school buses are expected to resume operations? How many of them have permanently closed?
I currently don’t have the data on that but LTFRB should have reference or baseline data. School service vehicles are required to register with the LTFRB and perhaps a look at the number registered before and during the pandemic could show how many can be expected to resume operations nationwide and per region. LTO doesn’t have these numbers as they only register by vehicle type. We will not know from LTO data which jeepneys, vans or buses are used for school service. Most school service are tied to the schools the student of which they provide transport services to. If the school closed, then chances are that the school service may apply to other schools. That said, the last two years where schools operated online were a backbreaker to many school service and only the registered numbers with LTFRB can tell us just how many are not returning at least for this school year.
3. How does the surge in fuel prices affect the operations of those involved in school transportation? Will this affect the ability of teachers, schools staff and students to travel on-site?
School services might increase their rates, which are usually monthly or semi-monthly. This is to make up for the increase in fuel prices and vehicle maintenance as well. This will likely only affect students’ travel rather than those of their teachers or school staff. The latter group will likely take public transport or their own vehicles for their commutes. In their case, their travel may be affected by transport fare increase or their own fuel expenses if they use their own vehicles. They have little choice though because they have to travel to work. Student though may still enjoy some respite as many schools are adopting blended or flexible schedules that will only require students to do face-to-face classes on certain days of the week.
4. What’s the long term impact of the pandemic on the school bus industry?
People will remain to be apprehensive in letting their children share a school van or bus ride due to the pandemic. We can only promote vaccination and compliance with health protocols to ensure that schoolchildren will have safe journeys as far as Covid-19 is concerned. The return to face-to-face classes this school year will perhaps help determine if the pandemic will have a long term effect on the industry or if people’s (parents and guardians) trust to school bus services will return within the short term.
5. How can school bus drivers and operators cope with the challenges posed by the pandemic and rising fuel prices?
LTFRB issued Memorandum Circular 2022-066, which adds health protocols for school service:
• Regular examination of the drivers and conductors’ fitness to work by checking their body temperature and screening for symptoms related to COVID-19.
• Regular disinfection of frequently-touched surfaces, such as but not limited to seats, armrests, and handles.
• Mandatory wearing of face masks at all times by drivers and conductors, including passengers.School transport services must comply with these protocols and demonstrate the safety of their mode to convince people to return to using or subscribing to school service vehicles. Meanwhile, there is really no escaping rising fuel prices but collective transport in the form of school service vehicles are still more efficient and cheaper per passenger compared to using private vehicles; not to mention contribute to reducing traffic congestion along school routes. This must also be promoted (i.e., people made aware of the advantages) vs. private vehicle use.
–
On electric vehicles and informal transport
I’ve been involved in studies on electric vehicles and their applications in the past. I continue to take part in studies about informal transport including continuing research on motorcycle taxis or “habal-habal” as they are called in the Philippines. The combination of the two is an interesting research area and there are many topics that can be developed as we determine the most appropriate applications for electric vehicles. Here is an interesting article on electrifying informal transport that sets the context for research:
Ribet, L. (August 30, 2022) “The role of data in electrifying informal transport,” Slocat partnership, https://slocat.net/the-role-of-data-in-electrifying-informal-transport/ [Last accessed: 9/9/2022]
To quote from the article:
“However, electric two-and-three wheeler startups, informal transport retrofitting pilots and e-bus initiatives cannot be the only answer to the mobility challenges facing developing cities. Phasing out oil-reliant public transportation is needed and investing in electric mobility solutions may well improve the overall picture quite substantially, but there is a far larger challenge that is omitted from these ambitions: addressing the complex operations of informal transport systems that characterise lower-income countries’ urban mobility. Electrifying minibus taxis is not synonymous with more reliable, affordable and convenient public transport, and we need to prioritise the understanding and improvement of overall informal transport systems data first.”
–
How my students see transport and traffic
With social media and the ascendance or popularity of influencers and the like, we have often encountered assessments or opinions about transportation and traffic. While there are those that make sense, there are more that are of the rant variety. The latter include the self-righteous who seem to relish bashing professionals and government officials while not being able to present much in terms of their own accomplishments. I am aware of my students (including research advisees) being aware of these people and I often see them posting their comments on topics, articles and opinions being shared on social media. For most, their comments and posts on social media show they’re being more informed than most, especially about the state of transportation in the country.
Here are some observations and comments from my students:
- One of my students asked me about my take on the public transport situation. I replied that it is unfortunate that public transportation has deteriorated the way it has for the past decades. The current state is not due to recent policies or regulations but a product of various policies, regulations and even trends over so many years. My student countered that perhaps the current officials must not make an excuse of the past in failing to act in the present.
- I always read about posts that anchor their arguments on the supposed low car ownership in Metro Manila. These are usually followed by calls for taking lanes away from car use for public transport and cycling. While I agree with the latter, I don’t with the former arguments. A student was curious about my statement in one lecture that we need to validate the numbers because what we see on the streets appears to be inconsistent with the notion of low car ownership. There are other ways, she said, to determine vehicle ownership other than the conventional HIS data. We could probably use the Family Income and Expenditure Survey (FIES) that is regularly conducted by the Philippines Statistics Authority (PSA). This will show if people own motor vehicles as well as how much they spend for transportation.
- I asked my students to critique the plans and implementation of airports in the Greater Capital Region (GCR) also known as Mega Manila, and which is larger than the NCR Plus used to refer to Metro Manila plus Bulacan, Rizal, Laguna and Cavite. I was not surprised about their assessments as all of them did their homework in the sense that they researched on information and data they could use for their critiques. Most were in favor of developing a new capital airport in Bulacan rather than in Cavite. And many favored the continued operation of NAIA but with reduced air traffic and a different role.
More on these opinions, observations and comments as I try to recall the more remarkable or notable ones.
Have a nice Sunday!
–
On the impacts of bicycle use
I’ve probably read a lot of posts on social media advocating for bicycle use. Here is another article that provides us with evidence about the impacts of cycling on travel, emissions and health:
Timmer, J. (August 20, 2022) “Here’s What Happens When Countries Use Bikes to Fight Emissions,” Wired, https://www.wired.com/story/bike-more-curb-global-emissions/ [Last accessed: 8/24/2022]
To quote from the article:
“Globally, adopting a Danish level of bicycle use would reduce annual emissions of CO2 by 414 million metric tons, approximately equivalent to the UK’s emissions in 2015. Boosting that to a Dutch level would eliminate nearly 700 million metric tons, or most of the emissions from Germany in that year.
The researchers also noted that countries like the Netherlands and Denmark have much lower rates of obesity than their peer countries. Based on the known health risks there, they estimate that, globally, we’re already avoiding 170,000 deaths annually due to cycling. Expanding this globally, they found that Denmark-equivalent bicycle use would prevent 430,000 deaths per year. Dutch levels of cycling would prevent 780,000 deaths.
That said, the vulnerability of cyclists to cars poses its own lethal risks. But these aren’t anywhere close to outweighing the benefits from exercise and lower obesity. (They’d add about 90,000 and 160,000 additional deaths per year for the two levels of use.) And if fewer drivers are using cars, there’s a chance that those numbers would come in even lower.
It’s worth noting that these numbers almost certainly underestimate the benefits of shifting to bikes. Bicycles use far fewer resources to produce, and they last longer than most cars. Maintenance is likely to be far less resource-intensive as well. So simply focusing on the use of the bike omits a lot of things that would show up in a detailed life-cycle analysis.
The researchers are certainly correct that there are a lot of locations where weather makes cycling a less-than-ideal option—and the range of places where heat makes it a positively dangerous option is expanding in our changing climate.
But some of the other issues are less severe than they might appear at first. For example, the advent of bicycles with electric assist means that hilly locales aren’t necessarily the barrier they might have been a decade ago. And while a number of countries have large open spaces where cars will remain a necessity, the trend toward urbanization means that most people in those countries will live in places where cycling can be made an option.
So, the biggest barrier is likely to remain the social will to rethink transportation.”
Indeed, social will (as well as political will) is perhaps the biggest barrier in our country. Many people may not agree but the evidence for this is so clear and obvious that one has to be naive or oblivious to not see it. How else will one explain people sticking to their cars and more readily shifting to motorcycles rather than the bicycle. Of course, there are other factors to be considered and the article actually cites wealth and geography as strong prerequisites in developing a cycling culture. We need to do much more to determine where interventions are needed including land use planning and land development as well as the provision of affordable housing closer to workplaces, schools, shops and other places of interest (Hello 10- or 15-minute cities!).
–
Free public transportation services?
We start August with an article share. Much has been said and written about public transportation being a basic right for people. And the experiences during this Covid-19 pandemic have shown us just how efficient and adequate public transportation can help make our lives better in terms of addressing our commuting or travel needs. Here is a very informative article that should make sense from the perspective of the general commuting public:
Konbie, N. (July 29, 2022) “The Case for Making Public Transit Free Everywhere,” Wired, https://www.wired.com/story/free-public-transit/?bxid=5bd6761b3f92a41245dde413&cndid=37243643&esrc=AUTO_OTHER&source=EDT_WIR_NEWSLETTER_0_DAILY_ZZ&utm_brand=wired&utm_campaign=aud-dev&utm_content=WIR_Daily_072922&utm_mailing=WIR_Daily_072922&utm_medium=email&utm_source=nl&utm_term=P7 [Last accessed: 8/1/2022]
To quote:
“Free fares might not get everyone out of cars, but will convert some journeys, which benefits everyone in terms of carbon reduction and improving local air quality—and even helps drivers by calming traffic. Free fares won’t pull low-income people out of poverty, but will keep money in their pockets and ensure everyone can travel when they need to. Ditching fares comes at a cost, but there are savings to be had by not investing in expensive ticketing systems and wider logistical and societal benefits…
Public transport should be considered a human right, alongside access to health and education.”
Of course, service quality is a major concern here in the Philippines but isn’t it everywhere else? The question of sustainability should be a rather complex one considering we haven’t truly understood and translated the benefits that can be obtained from providing high quality public transport services vs. being car-oriented. Congestion pricing, for example, could very well provide the funds to improve, upgrade and maintain desirable public transport services (i.e., desirable from the perspective of most commuters and not just the lower and middle income people who more regularly or likely to take public transport than other modes of transport).
What do you think?
–
On the benefits of developing and investing in active and public transportation
Here is another quick share of an article with a very relevant and timely topic – the business case for multimodal transport planning:
Litman, T. (July 2022) “The Business Case for Multimodal Transportation Planning,” Planetizen, https://www.planetizen.com/blogs/117697-business-case-multimodal-transportation-planning?utm_source=newswire&utm_medium=email&utm_campaign=news-07142022&mc_cid=03c159ebcf&mc_eid=9ccfe464b1 [Last accessed: 7/15/2022]
To quote from the article:
“Conventional planning tends to undervalue non-auto mode improvements by assuming that each additional mile of their travel can reduce, at best, one vehicle mile traveled. In fact, in many situations they can leverage much larger reductions in vehicle travel, meaning that each additional mile of walking, bicycling, or public transit can reduce more than one vehicle mile … As a result, walking, bicycling and public transit improvements can provide much larger vehicle travel reductions and benefits than is commonly recognized.”
There is a box referred to in the preceding quote. I will not reproduce it here so I leave it up to the reader to go to the original article by Litman to find out how active and public transport can leverage additional travel reductions. Understanding these and the extend by which we can be independent of car-use (referring to non-car travel demand) will allow for a better appreciation, travel-wise and economics or business-wise, of the advantages of developing and investing in active and public transportation infrastructure and services.
–
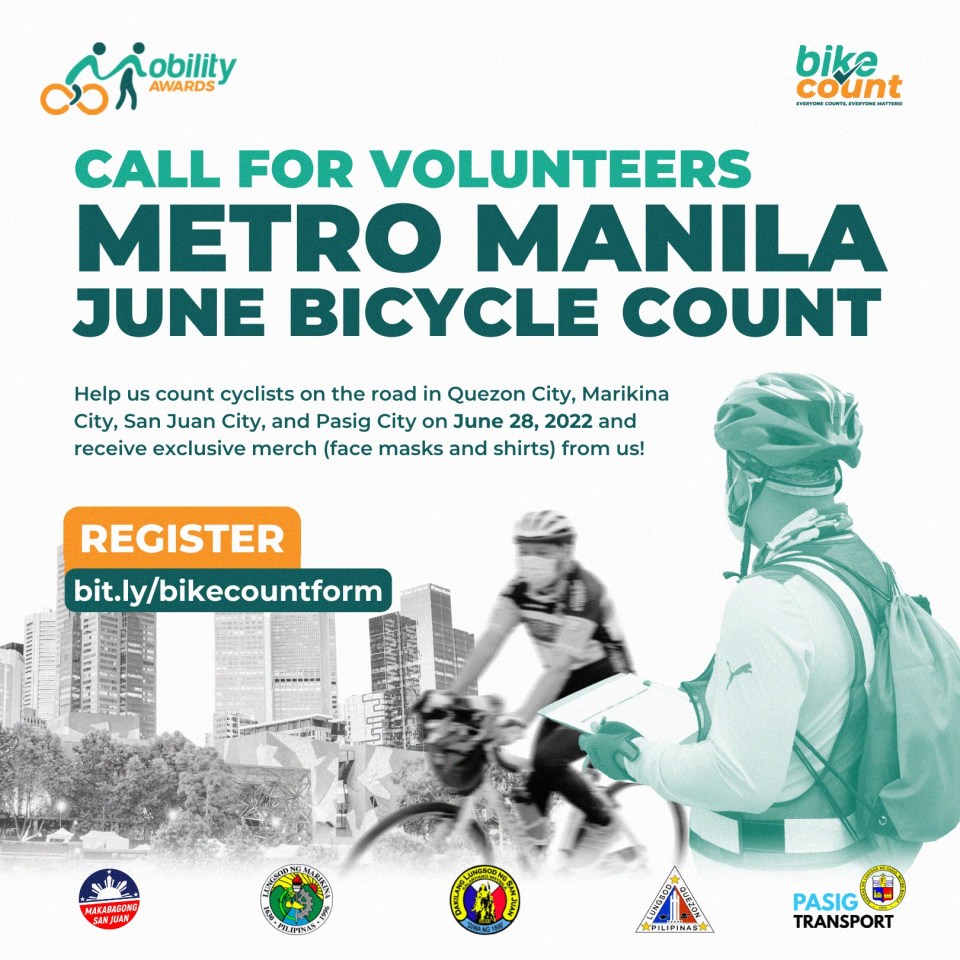
On bike counts – Part 1
Bike counts are being conducted this June and July in many cities around the country to mainly determine the number of cyclists in various locations in the participating cities and if there was an increase in the numbers. An increase will be encouraging and should support the upgrading and expansion of the bike lanes network established during this pandemic (we are not yet in the post-Covid-19 age).
The following Images are from the Mobility Awards Facebook Page where you can find the rationale for these surveys. Vehicle or pedestrian counts are perhaps the most basic type of surveys and are conducted over certain periods of time to establish variability as well as seasonality. In the case of most if not all the counts mentioned below, surveys were and are to be conducted during the perceived peak periods for bike traffic: 6:00 to 8:00 AM and 4:00 to 6:00 PM.


Counts like these need to be evaluated or analyzed considering various contexts. While the outcomes of such counts are often presented from the point of view of advocates and there is a tendency to play with the numbers (which I will explain in more detail in succeeding posts), the bigger picture relating bike numbers to other modes of transport would be among the most important. Trip purpose is another essential factor to be considered. And there is also data on the origin-destination characteristics of trips. Historical or time series data is also important if trends are to be established.
By itself, these bicycle counts are very important data that will ultimately be useful for planning, design and construction of facilities for active transport. The lack of data on bicycles while there is a bias for motor vehicle data means we cannot see the complete picture and therefore remain car-centric when dealing with transportation issues.
–
A Bike Master Plan for Metro Manila, Metro Cebu and Metro Davao
Before Active Transport Week concludes this weekend, I would just like to share this collage from one of our staff at the National Center for Transportation Studies of the University of the Philippines Diliman. It is about the Master Plan developed for the three metropolitan areas in the country – Metro Manila, Metro Cebu and Metro Davao. I will share more details about this soon including a link or links to where you can download a copy of the plan.

The project concluded recently with the submission of the Final Report but most important is the Master Plan document that can serve as a reference for further development of bike lanes in the metropolises. I’ve seen the Master Plan and many of its provisions and recommendations can easily be adopted or is replicable in other cities and municipalities in the country. Perhaps, there should be a National Master Plan?
–
Flashback: Transport Infrastructure Framework Plan for the Philippines
I was reading an article yesterday about the outgoing NEDA Director General stating that Philippines needing a long term strategy for infrastructure development that will address the shortcomings or gaps due to unsolicited proposals. There was already something like this drafted almost a decade ago and under the auspices of the returning NEDA DG. Unfortunately, while NEDA accepted the Final Report of the study, they never adopted it as a policy that could also be imposed on agencies like the DOTr (still DOTC back then) and the DPWH. So for a sort of Throwback Thursday and on the last day of the Duterte Administration, I am sharing the promotional video produced for the framework plan that was supported by The World Bank.
The study was conducted by Cambridge Systematics (not related to Cambridge Analytics as far as I know) and was implemented at the same time as the JICA Dream Plan study for Mega Manila. I recall there is also a video on the latter and it listed all the infrastructure projects needed to address the transport problems of the Greater Capital Region. The Infra Framework Plan for the country mentions the various infrastructure projects ongoing and proposed for the Philippines but focuses on the soft side (i.e., strategies) including the reforms and institutional set-up that need to be in place for everything to come together and produce the desired outcomes in the long term. Sadly, strategies and plans are not well appreciated despite their being essential as foundations. While the Build, Build, Build mantra of the outgoing administration is worth praising for attempting to do the catch-up needed in as far as certain transport infrastructure is concerned, it falls short of what are necessary and to be prioritized. Instead, it ended up accommodating projects that are “nice to have” but should not be prioritized considering our limited resources and the undesirable foreign debt racked up by government. Hopefully, the returning NEDA DG and other officials will be able to steer the country clear of the current and future crises that may end up bringing more hardships on Filipinos.
–
Bike lanes at Bonifacio Global City
After settling down at our new ‘tambayan’ at BGC, I decided to take my regular morning walk around the area to familiarize myself with the environs and to establish a route that I and the wife would likely be taking for our constitutionals whenever we are staying at BGC. I took the following photos of the bike lanes along 38th Street where most of the locators are international schools.


During Saturday and Sunday mornings, the bollards are moved to the sidewalk as many cyclists use 38th Street for laps. I wonder if the bike lanes will be retained once the schools resume face-to-face classes. That would mean a tremendous number of private vehicles generated by the international schools and colleges here. My opinion is that the bike lanes need to be retained as it is a step in the right direction for transport and encourages people to cycle or take PMDs to work and perhaps to school. These and others like it in Metro Manila and around the country need to be sustained and further developed to be attractive and viable to many seeking another option for mobility and their regular commutes.
–