
Home » NMT (Page 6)
Category Archives: NMT
On bicycle economics in the Philippines
I am sharing this link to a newly minted reference that should be useful to policy or decision-makers (yes, that includes politicians) in justifying bicycle facilities including bike lanes around the country.
https://www.freiheit.org/philippines/bikenomics-assessing-value-cycling-philippines
There’s been a dearth in local references and this should suffice for now pending more in-depth studies on the benefits of cycling and related-facilities and programs in the Philippines. Note that while the reference mentions certain calculations and unit costs, it would be better to have the actual numbers from the various LGUs that have constructed bike lanes and facilities, and implementing bike programs and projects. Quezon City and Mandaue City, for example, should have the numbers that can serve as initial data for compiling and eventual publication of unit costs per type or design of bike lanes or bikeways. LGUs and national government should gather, process and make use of such data in aid of bike facilities and infrastructure development that will attract people away from private motor vehicle use while reinforcing both active and public transport mode shares.
–
Article on how cities can rapidly expand bike networks
With the increasing popularity of bicycles for utilitarian use (e.g., bike to work, bike to school, etc.), the need for strategies, programs and projects to support cycling has become more urgent. This is mainly to sustain the increase of bicycle use and partly to enhance the safety of cyclists. Here is an article that discusses how cities can rapidly expand bike networks:
https://www.urban.org/urban-wire/how-can-cities-rapidly-expand-access-cycling-infrastructure
To quote from the article:
“Our research points to several key recommendations for other cities hoping to expand their cycling infrastructure and encourage a more rapid shift toward biking and away from cars.
– Local governments can lead the implementation of a large-scale expansion of cycling infrastructure if local leaders can commit to ambitious, quantified mileage goals that will help structure how capital dollars are spent.
– Local implementation goals should include metrics related to increasing equity, particularly for people of color and those with low incomes. Although the Final Mile program increased the number of miles of cycling infrastructure, it did not directly prioritize the people who could benefit most from improvements.
– Philanthropic funders interested in supporting climate-friendly infrastructure should ensure their funds help hold local policymakers accountable to achieving their commitments instead of funding infrastructure projects directly. They can also encourage collaboration between cities and nonprofit advocates while working to fill local capacity gaps, such as through engineering consultants.”

Article on evaluating transport equity
Here is another quick share of an article on transportation equity:
Litman, T. (February 2, 2022) “Evaluating Transportation Equity: ITE Quickbite,” Planetizen, https://www.planetizen.com/news/2022/02/116058-evaluating-transportation-equity-ite-quickbite [Last accessed: 2/4/2022]
Transportation equity is a very relevant, very timely topic as people in the Philippines are just beginning to understand and weigh the advantages of having more efficient transport in the forms of active and public transport over private vehicles.
–
The case for bike lanes
There is a strong push for more bike lanes to be developed along both major and minor roads. Many pop-up bike lanes that were implemented and permanent bike lanes constructed in 2020, mostly during the lockdowns, to address the needs of ‘frontliners’ who opted to bike to work have been retained and even upgraded to adhere to guidelines issued by the DPWH. While these bike lanes are not yet as comprehensive as desired and most are not the protected types, recent developments have threatened their existence and consequently the safety of cyclists (especially bike-to-work) and the promotion of cycling as a primary mode of transport.

We need to transform our streets where it is possible in order to take advantage of the increasing popularity of cycling that has convinced some people to select cycling at least for their last mile trips and hopefully for the most part(s) of their commute. From a transport planning perspective, we should also determine if these mode shifts can be sustained and perhaps increased with proper integration of public transport and active transport thrusts.
The recent removal of protected bike lanes or barriers that serve to protect cyclists using the lanes in some cities are examples of regression rather than progression. These come as a surprise as these cities have made leaps and bounds so to speak in developing their bike lane networks. Where did the orders to do so originate and are staffs of these cities communicating, discussing and coordinating these actions? Apparently, there are internal conflicts and perhaps, I dare say here, politics involved. It is also possible that within LGUs, the concepts, visions and plans for transportation are not harmonized or understood making one project by one clique unacceptable to another or others. I know from personal experiences that LGU traffic engineering & management and operations staff are often not in synch with their planning counterparts. This is not and should not be a given since both need to collaborate in order to address transport and traffic issues that need more comprehensive and progressive approaches compared to what have been practiced before.
LGUs cannot rely on strategies and tactics that are along the lines of “ganito na ginagawa noon pa” or “ganito na inabutan ko”, which only proves these were ineffective (i.e., why not try other techniques, methods or strategies instead?). Transformations and paradigm changes to solve transport problems cannot be achieved by denying the change, innovation or new ideas required for emerging as well as persistent issues/problems.
–
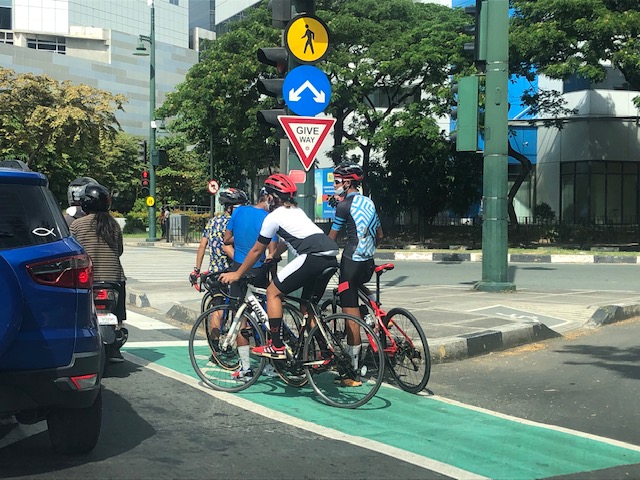
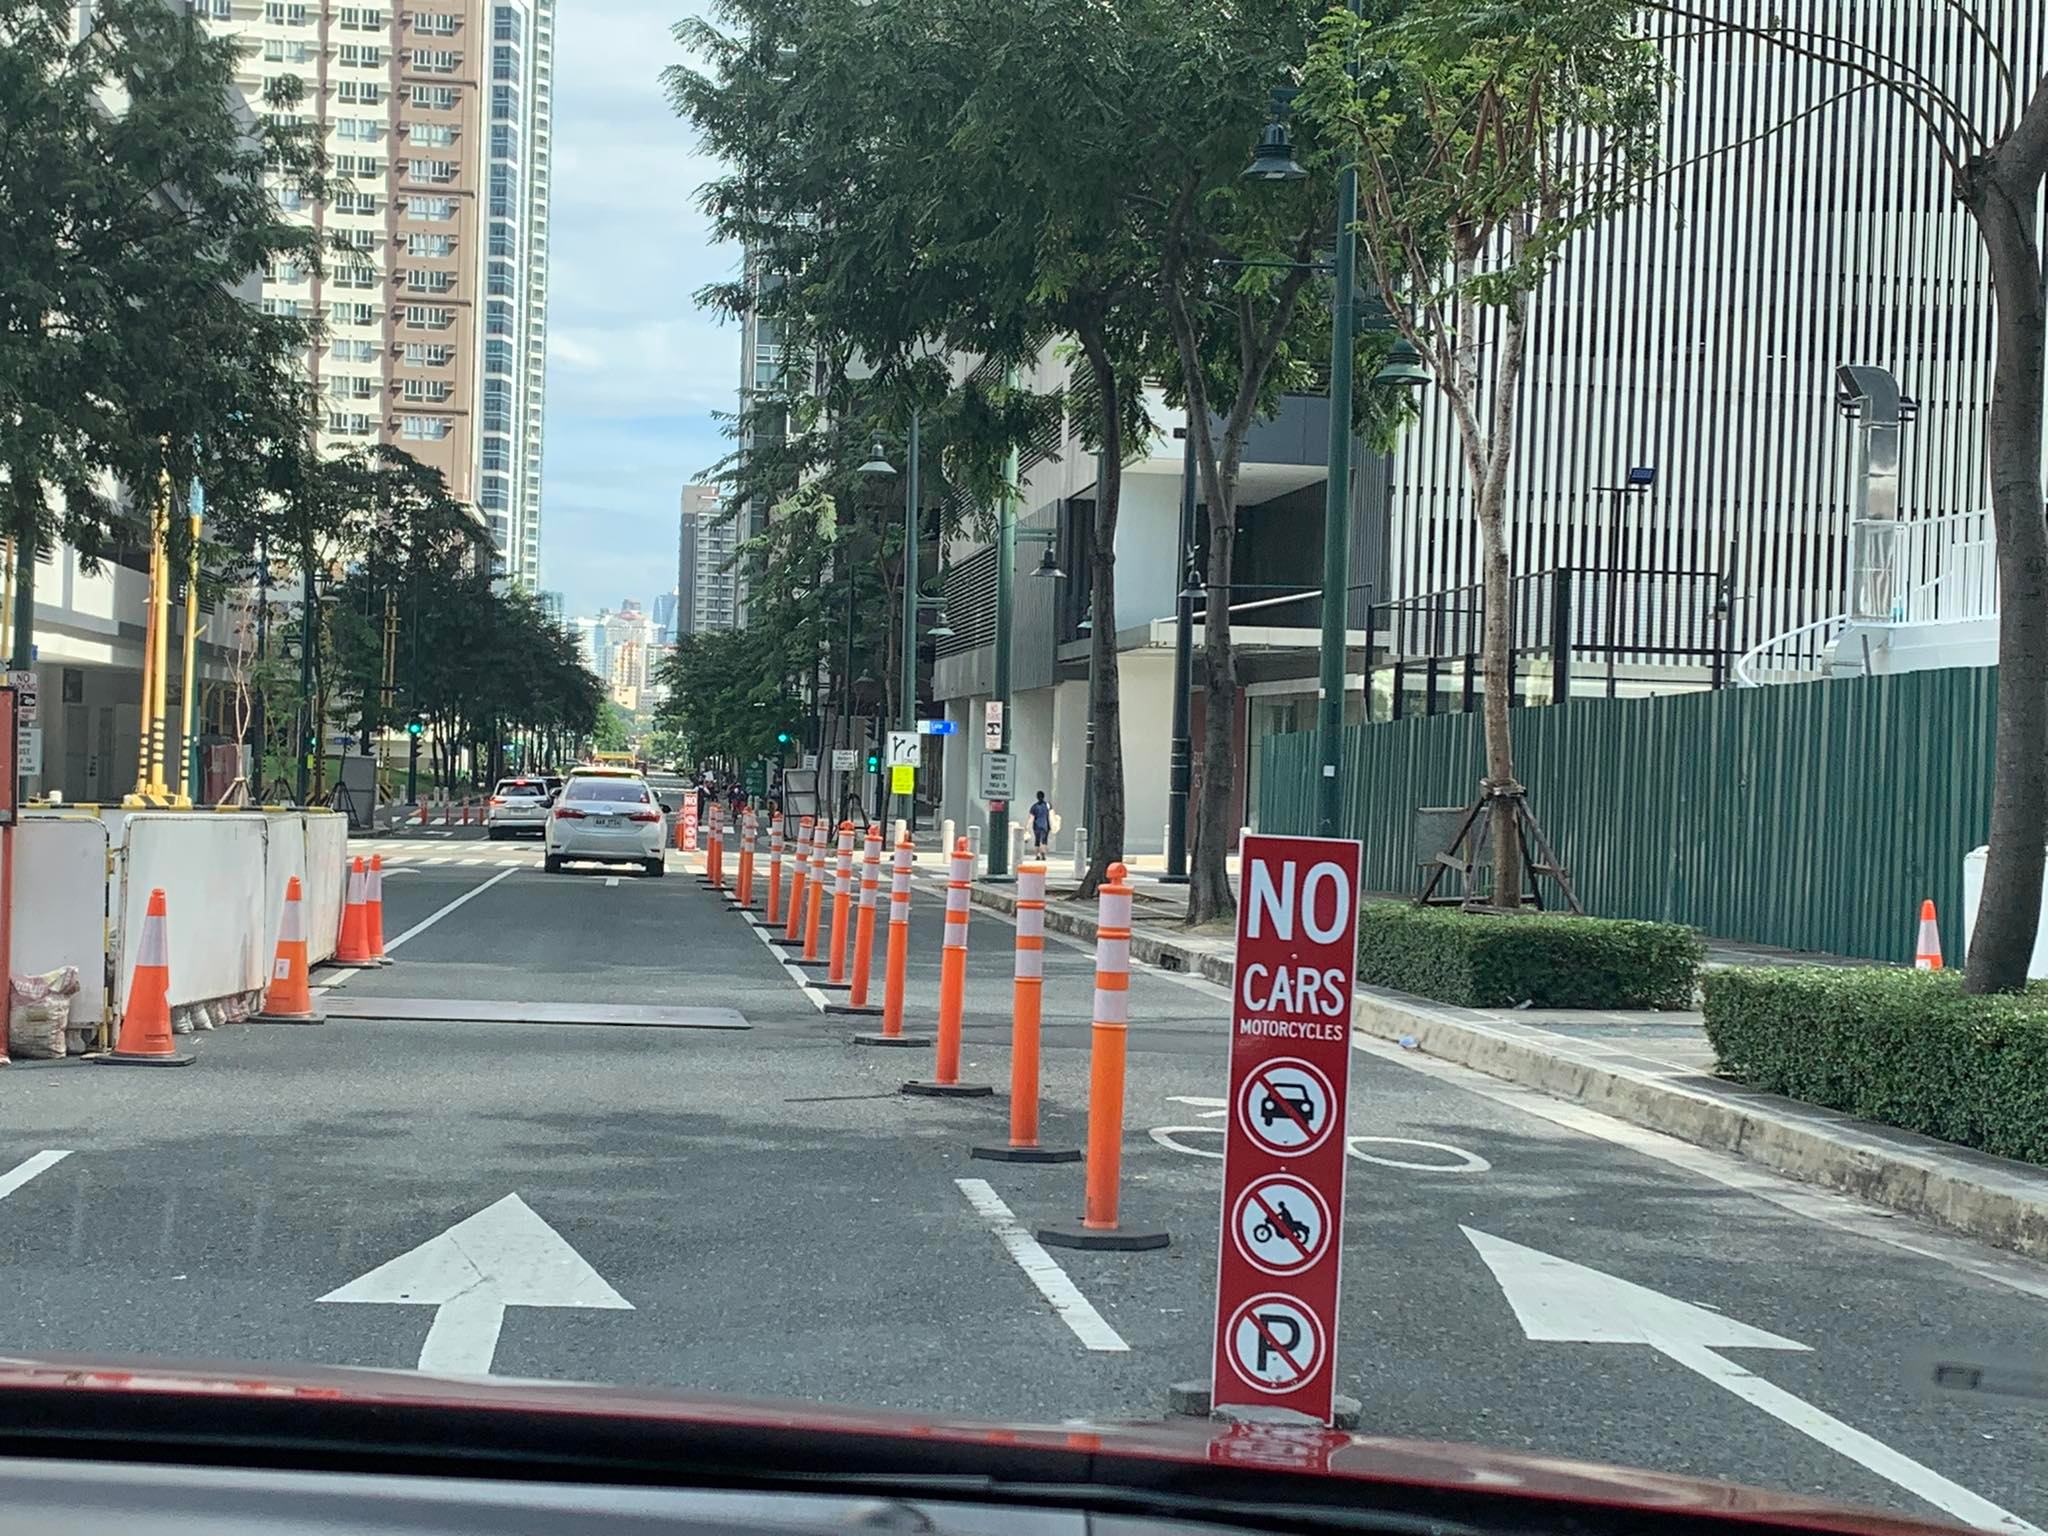
Bike lanes at BGC
We were at the Bonifacio Global City (BGC) a couple of weeks ago after almost two years of not going there mainly due to the pandemic. We frequented BGC before especially since my wife’s office is there and, if it weren’t for the ‘old normal’ traffic, the place offered a lot in terms of restaurants and shops. When traffic wasn’t as bad, we even had our Saturdays there with our daughter as her Kindermusik sessions were originally there before we transferred to their branch at The Grove. It’s not yet post-pandemic but traffic is back to ‘old normal’ levels.
I was expecting to see the bike lanes along C5 and at BGC when we traveled there. I will post separately about the bike lanes along C5. I just wanted to share here a few photos the wife took of the bike lanes at BGC. It is truly a welcome development not just here but in many places across the country where cycling offers another option for trips of various purposes including commuting between homes and workplaces. The protected lanes along 9th Avenue are wide and can be replicated elsewhere in order to encourage more people to use bicycles. The connectivity of bike lanes, though, leaves much to be desired if one expects people to use bikes for longer trips.


–
Safe streets for children
We have been working with UNICEF and several partner organizations on a project on Child Road Traffic Injury Prevention (CRTIP). The Final Reports for the two pilot cities, Valenzuela City and Zamboanga City, have been submitted and represents over 2 years work including during the lockdowns due to the Covid-19 pandemic. The latter part of project implementation indeed became a challenge as we couldn’t travel and engage face-to-face or conduct field surveys like how we did in the first part of the project. Still, I believe we were able to accomplish much and most of what we initially set out to do. Here are the covers of the Final Reports we submitted to UNICEF and we understand will be officially or formally transmitted to the two cities.


The reports narrate the surveys conducted for 25 schools in Zamboanga and 41 schools in Valenzuela. Each initially had selected 25 schools but Valenzuela pushed for an additional 16 schools midway into the project. The SR4S tool developed by iRAP was used for the assessments of critical areas around the schools. The initial assessments were used to identify interventions to improve safety in these areas and recommendations were submitted for consideration of the cities as well as the DPWH where applicable (i.e., the DPWH has jurisdiction over national roads and improvements proposed along these). While some interventions were implemented, others and many were delayed mainly due to Covid-19.
We also conducted a survey to determine the commuting characteristics of schoolchildren in both cities. Since most schools were public schools, it was no surprise that most children lived near the schools or within the school district (which is basically the catchment area for these schools). Thus, it also came as no surprise that most schoolchildren came by foot (walking), motorcycles (riding with a parent) or motor tricycle. There’s a lot of information and takeaways from the data but unfortunately, we could get the bigger, more complete picture of Valenzuela City because they selected only elementary schools covering students from Grades 1 to 6. Zamboanga had a more robust data set with both elementary and high schools, covering Grades 1 to 12. The information derived from these surveys were also analyzed and related to the SR4S assessments. The commuting survey results and SR4S assessment are subject of two technical papers presented in the recent EASTS 2021 conference hosted by Hiroshima University.
What’s next? We are now drafting a proposal for a Phase 2 of the project. We hope to continue and reinforce and follow-up on the recommended interventions from Phase 1. We also hope to be able to work on the CRTIP data hub that was only partly completed due to the many constraints faced by that part of the project. I will post here from time to time about some of the outcomes from the surveys and assessments.
–
On why people are afraid to bike
There is an interesting graphic shared by a friend on his social media account. I am also sharing it here. The source may be found at the bottom right of the graphic.

I think the graphic speaks for itself. How can we encourage people to bike whether for commuting or other utilitarian purpose if there are nuts behind the wheels of many motor vehicles? All the points raised in the graphic are true for the Philippines and are not limited to drivers of private vehicles. These are also the same for public transport drivers as well. And these cannot be solved or addressed overnight. You have to get to the roots of the problem, which are about the driver and rider education (i.e., training), and the licensing system of the Land Transportation Office (LTO).
While there are driving and riding schools that have proliferated, many seem to just go through the motions of driver and rider education. Prospective motor vehicle drivers and riders often just learn enough to pass a flawed examination to get their licenses. Do they really learn about how to behave properly when driving or riding? It certainly does not show with how they deal with cyclists and pedestrians. As for enforcement, well that’s another topic to discuss in a separate post.
–
On defining the 15-minute city
I have shared articles and briefly written about the concept of the 15-minute city on this blog. Here is another discussing how a 15-minute city is defined:
(February 8, 2021) “Defining the 15-minute city,” Public Square, https://www.cnu.org/publicsquare/2021/02/08/defining-15-minute-city [Last accessed: 8/10/2021]
Here is an image from the article:
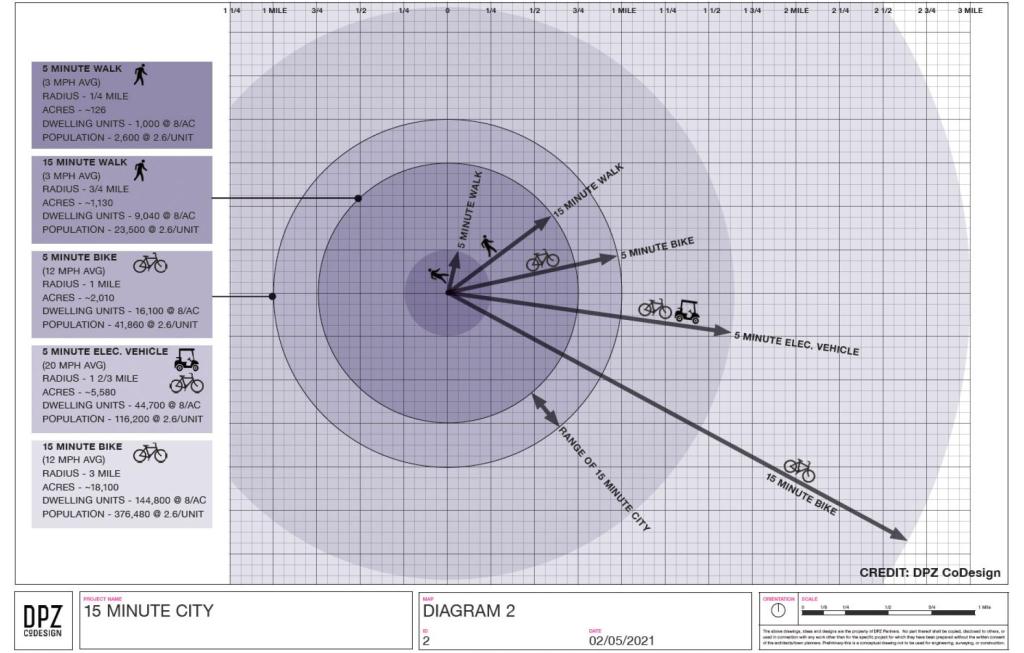
Again, it is important to contextualize these concepts. I share these as references and topics for discussion. Of course, I have my own opinions about this and I have written about those in previous posts. I guess in the Philippine context, we can include the pedicab or non-motorized three-wheelers in the discussion. These are also very popular modes in many cities and municipalities despite their being also prohibited along national roads like their motorized counterparts. It would be nice to have more visuals in the form of maps that show travel times for essential destinations or places like hospitals, markets, grocery stores, workplaces and, of course, homes. I assume there is at least someone, somewhere who perhaps have made multi-layer maps of this sort and attempted to related them along the lines of this concept of a 15-minute city (or perhaps the even older “compact cities”).
–
On quantifying the benefits of bike share
I’m sharing another article that presents a quantification of Such articles and studies are gaining interest as cycling or biking becomes a popular choice for many seeking an alternative to their usual or former modes of transport. It helps that there are many initiatives promoting active transport in general and cycling/biking in particular.
Wilson, K. (July 23, 2021) “Study: Bike Share Saves the U.S. $36 Million Public Health Dollars Every Year,” StreetsBlog USA, https://usa.streetsblog.org/2021/07/23/study-bike-share-saves-the-u-s-36-million-public-health-dollars-every-year/ [Last accessed: 8/6/2021]
While the article is about bike share, the conclusions can be extended to cycling/biking in general. The article points to at least 3 major areas where benefits can be derived: safety, air pollution (reduction) and physical activity. To quote:
“I think the message to cities is that bike share — and biking in general, though that’s harder to quantify in the way we do in this study — can contribute a lot to their long term goals,… Most cities want to improve quality of life, the economy, the climate, and their public health outcomes. Bike share does all those things.”
–
Another look at the ‘avoid, shift and improve’ framework
The transport and traffic situation during this pandemic has revealed a lot about what can be done and what needs to be done about transportation. Discussions about what and how people visualize their ideal or acceptable transportation system reminded me of the backcasting concepts and the tools. The following diagram is sourced from the SLoCaT homepage: https://tcc-gsr.com/global-overview/global-transport-and-climate-change/
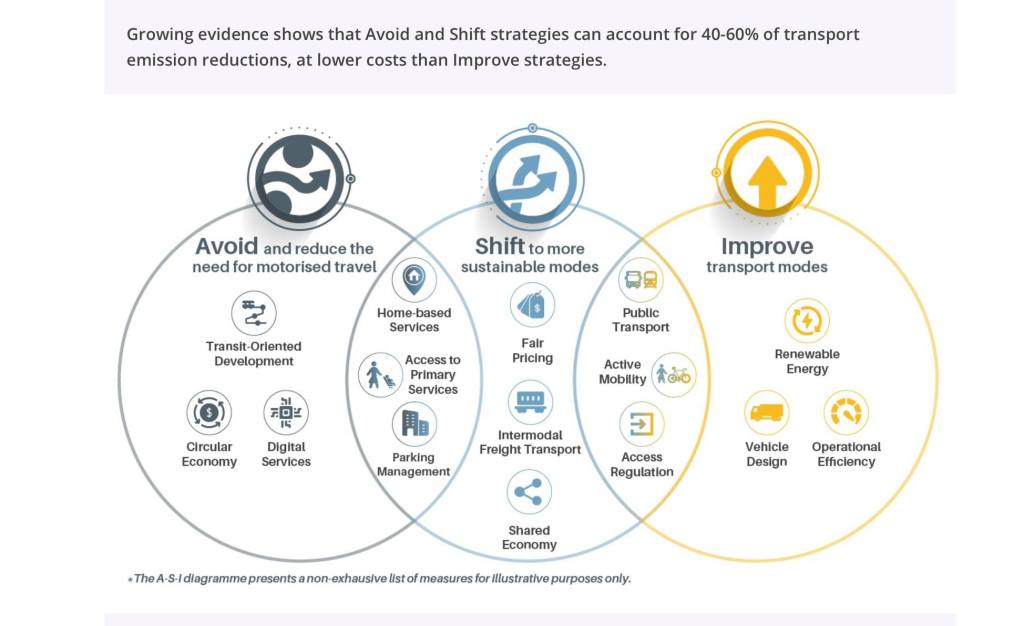
Note the overlaps among the three? Do you think its possible to have a measure that’s avoid, shift and improve at the same time?
Note, too, that if we contextualize this according to the Covid-19 pandemic, these measures even make more sense rather than appear like typical, ordinary measures we have about transportation. The pandemic revealed many weaknesses or vulnerabilities of our transportation system. We are presented with the opportunity to address these and implement certain measures that would have met with a lot of opposition before but can probably be rolled out now such as public transport priority schemes and protected bike lanes. “Work from home” is not really new since the concept has been proposed and implemented before but not as widely as was required by the pandemic situation. So perhaps we should take advantage of this forced reboot of sorts for our transportation system to be able to implement this A-S-I framework.
–
