
Home » Transport Planning (Page 3)
Category Archives: Transport Planning
On walkable spaces for senior citizens
Here is a quick share of an article on walking and walkability, and the relation with dementia:
Steuteville, R. (March 10, 2025) “Living in a walkable place reduces dementia,” , https://www.cnu.org/publicsquare/2025/03/10/living-walkable-place-reduces-dementia [Last accessed: 3/29/2025]
To quote from the article:
“When we live in a walkable place, we move more, naturally. Unsurprisingly, exercise is linked to better cognitive health. Regular exercise increases memory, and boosts hippocampal volume by 2 percent.
Also, walkable neighborhoods are more stimulating. They are built on connected street networks, which give individuals more choices on how to get around and reward those choices with diverse physical paths linked to spatial memories. And they are mixed-use.
“Street layouts with better connectivity and walkability are associated with a reduced risk of cognitive impairment. Access to local amenities, such as food stores, community centers, and healthcare amenities, supports cognitive health,” the authors note.
Social connections also probably help. When you walk to a destination, you are more likely to have friendly interactions, which have been shown to reduce the risk of depression, and walkable places also boost the sense of community.”
As there are many senior citizens in our village, the topic is quite relevant. Most seniors probably won’t take a walk if they felt it was dangerous or risky even inside residential subdivisions. In our neighborhood, there are a few of them going around using their motorcycles or scooters. Most I see walking around perhaps for exercise or leisure rather than to go to a store or restaurant in the area. But increased traffic due to customers of restaurants that sprouted around the village has increased the risk for those who walk. Hopefully, the induced motor vehicle traffic generated by these establishments can be managed and regulated for the overall welfare of residents.
–
On C-6 and the proposal for another expressway, Part 1
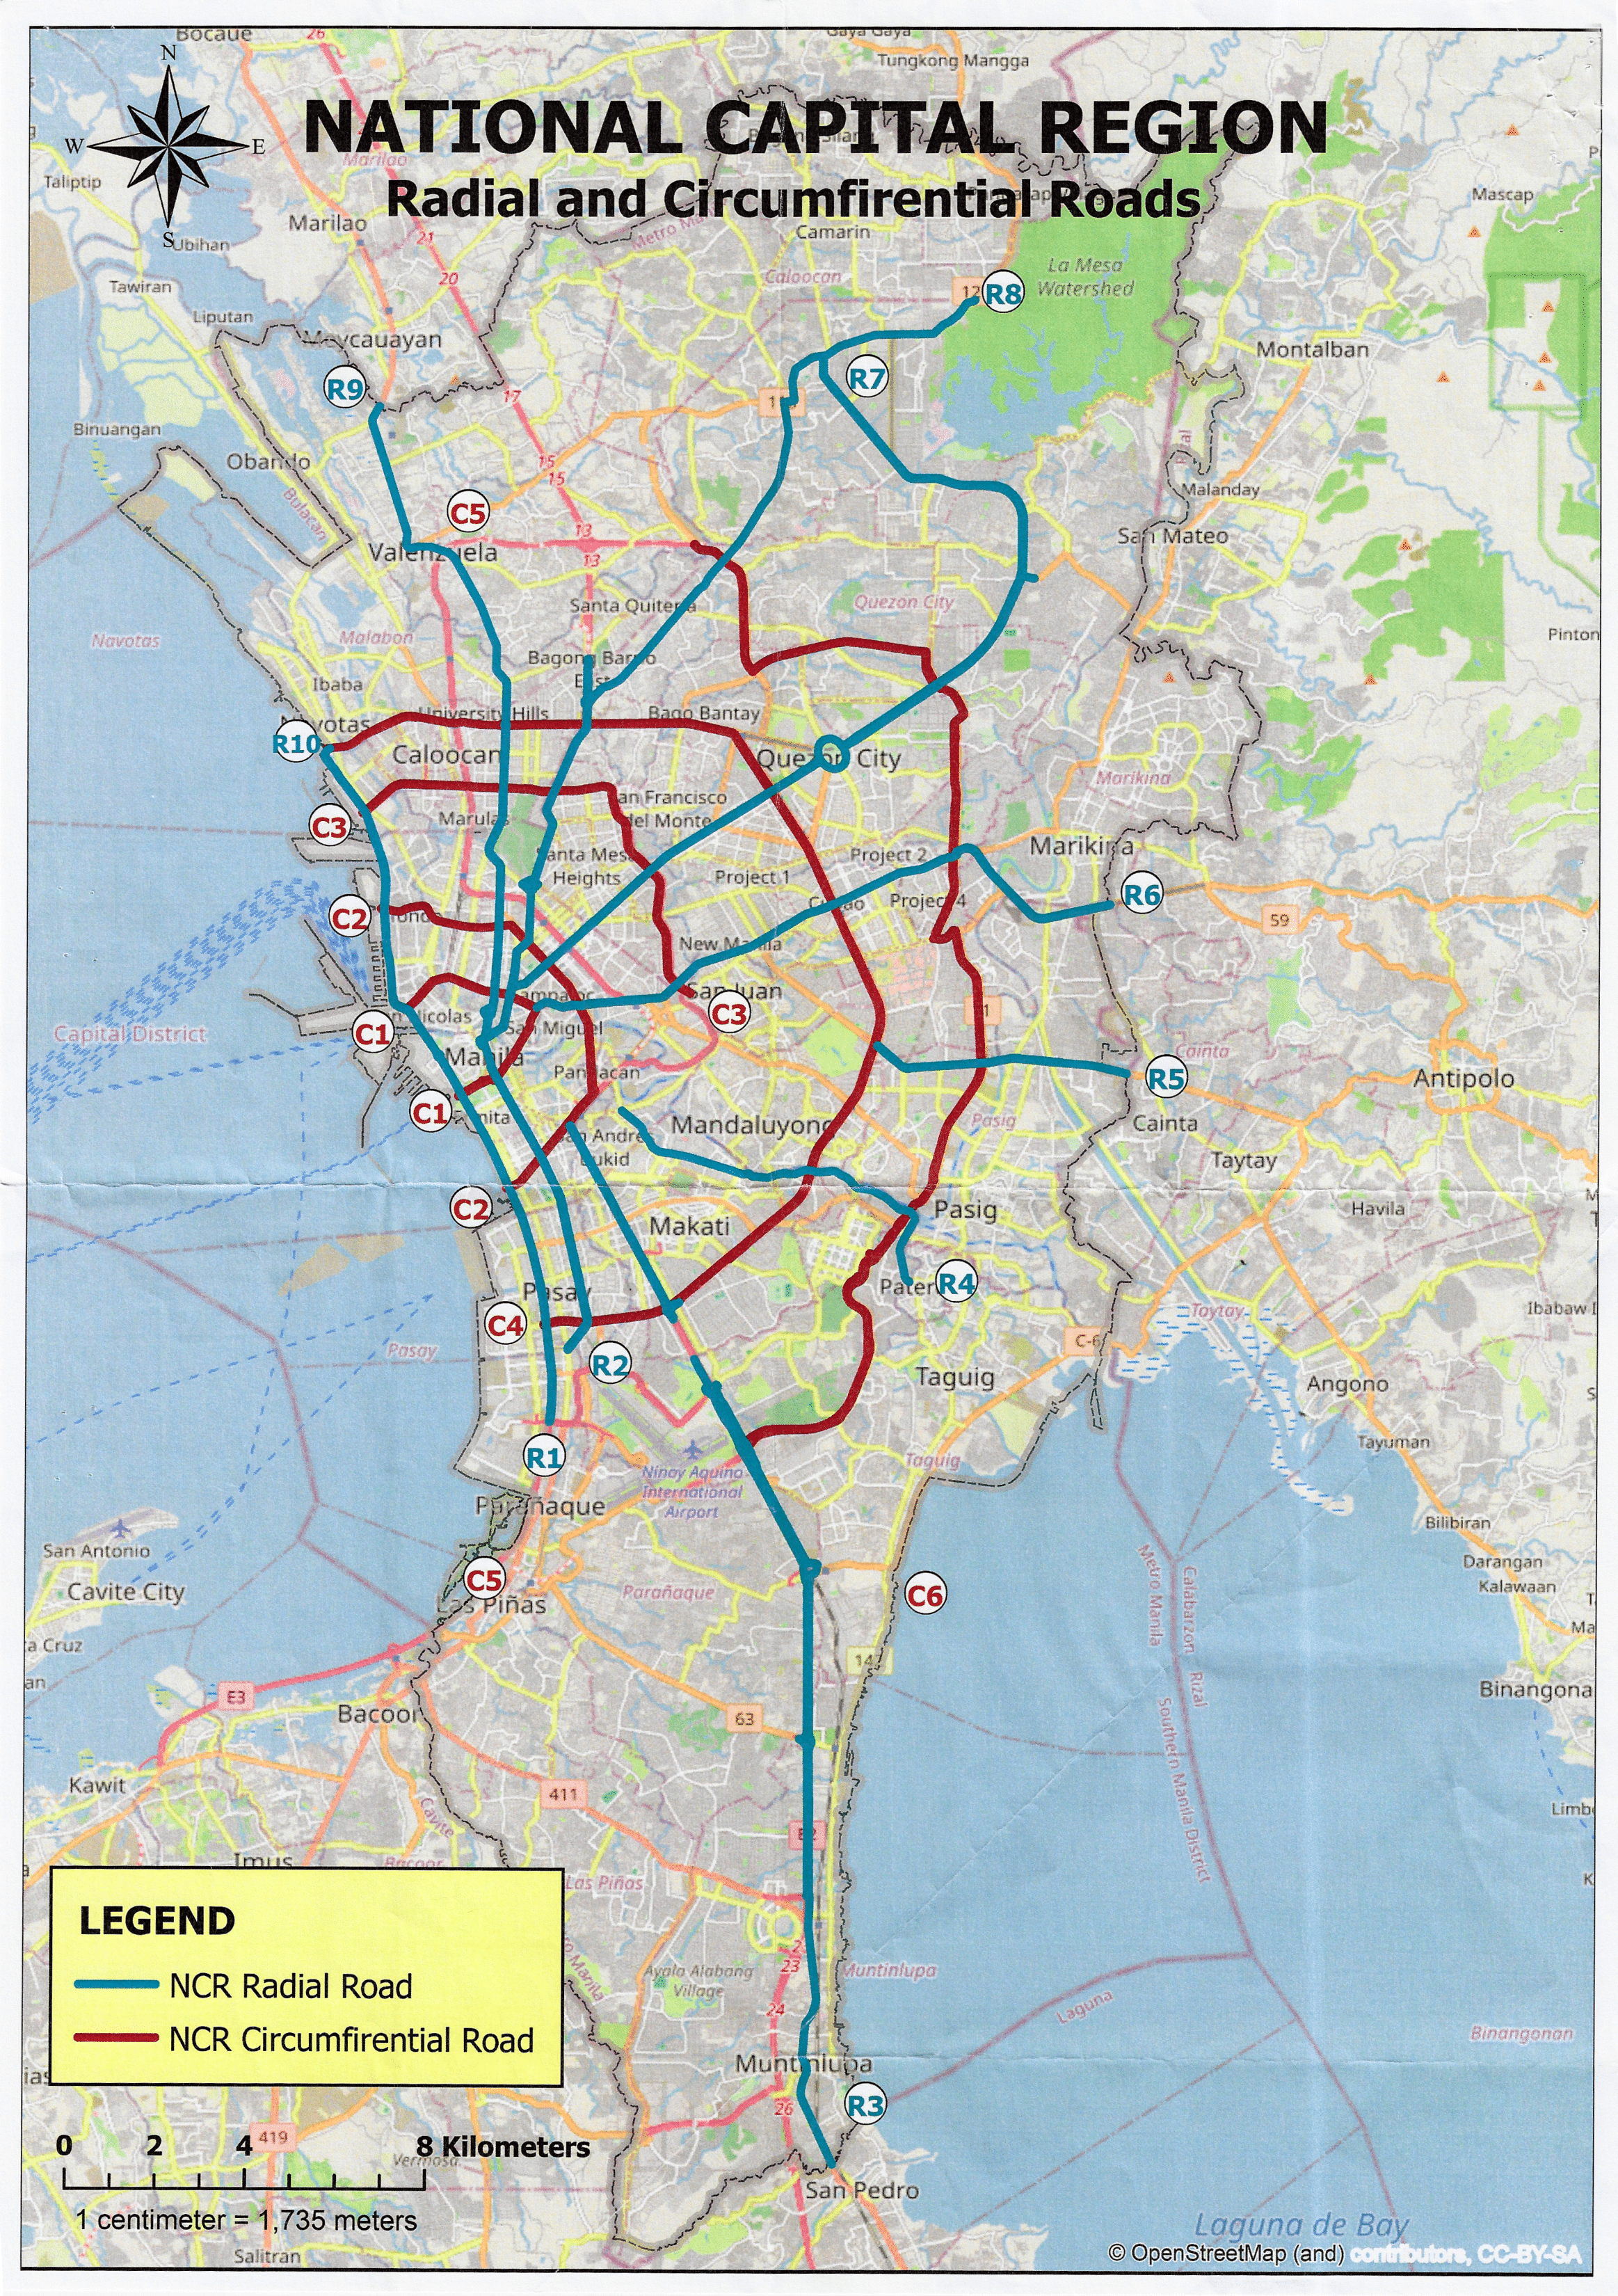
I’ve written about Circumferential Road 6 many times in the blog. Mostly, these were about the existing sections along the Laguna de Bai in Taguig and Pasig cities of Metro Manila and Taytay in Rizal Province. I share below two maps showing different alignments of C-6. The first one is a rather old one from the 1990s that I recall was from a presentation of a friend at DPWH.
 An old map I got from the DPWH a long time ago that I have used in my lectures.
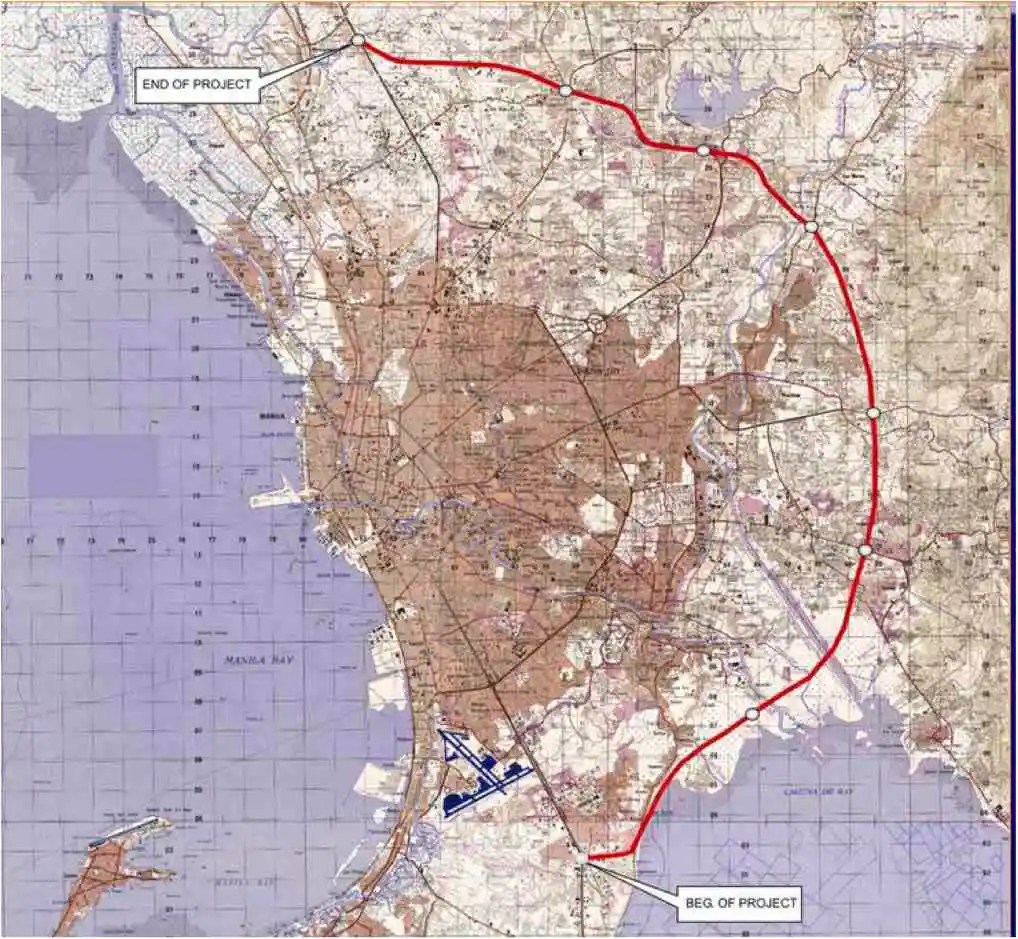
The second map is supposed to be more recent, perhaps in the last 5 to 10 years if not more recent. This shows a more realistic alignment composed of what looks like existing road sections that were connected to form a semblance of a circumferential alignment.
 Here is a more recent map that’s also attributed to the DPWH.
In the first map, you will notice that the proposed alignment is more circular and smoother. This means that the road would have had a mostly new alignment instead of utilizing existing roads like Circumferential Road 5 before it. The newer sections for the latter were the ones connecting the existing roads. For the second map, noticeable is the somewhat forced connections of what looks like existing roads on the map. And while for Map 1 the alignment will be passing under the La Mesa reservoir, the alignment for Map 2 will circle the watershed like a coastal road. The alternative alignments presented an interesting exercise for students of highway engineering particularly for the topic of alignment design. Do you pick an entirely new alignment, sketch it out and determine the crossings and other constraints or do you try to make do of what roads are existing and perhaps improve (i.e., widen) these to produce an arterial?
The proposed alignment for what is now called the Southeast Metro Manila Expressway (SEMME) seems closer to the alignment in Map 1 than the one in Map 2. I will write about the proposed expressway that was recently launched in the next post.
–
From 9-to-5 to Anytime: How Telecommuting Changes the Traffic Game
Here’s a quick share of an article on telecommuting:
Source: From 9-to-5 to Anytime: How Telecommuting Changes the Traffic Game
To quote from the article:
“As we look across these 83 cities, it’s clear that remote work has brought relief to some areas while leaving others just as crowded as before. The cities seeing the most benefit from WFH were those with a flexible, remote-friendly workforce and a supportive economic structure. For fast-growing cities, or those with heavy industry or logistics, WFH alone wasn’t enough to solve congestion.
Telecommuting has no doubt reshaped our roadways, but it’s clear that tackling urban congestion will require more than just a remote work policy. As cities continue to grow and evolve, the future of urban mobility will rely on creative solutions, from smarter infrastructure to updated transit options, to keep America’s cities moving in this new, work-from-anywhere world.”
There are lessons to be learned here for us in the Philippines. Telecommuting is not a new thing here especially considering we have many BPOs operating across the country. Indeed, it is not to be considered as the only solution but one of many we can use to reduce congestion and improve commutes in our towns and cities.
–
Planning for True Transportation Affordability: Beyond Common Misconceptions
How much do we spend on transportation as part of our budgets? Is it 5% of your monthly budget? Is it 10%? Or is it eating up a substantial part of what you’re earning?
Source: Planning for True Transportation Affordability: Beyond Common Misconceptions
To quote from the article:
“This research indicates that many common policies favor expensive transportation and housing over lower-cost alternatives, which drives the cost of living beyond what is affordable, leaving too little money to purchase other necessities. The result is immiseration: growing stress, unhappiness, and discontent.
The solution is simple: planning should favor affordable over expensive modes and compact development over sprawl. This is not to suggest that automobile travel is bad and should be eliminated. Many people are justifiably proud of being able to afford a nice car, and automobiles are the most efficient option for some trips. However, automobile travel requires far more resources and is far more expensive than other modes, typically by an order of magnitude, so true affordability requires an efficient, multimodal transportation system that allows travelers to choose the options that truly reflect their needs and preferences.
Affordability requires a new economic paradigm; rather than trying to increase incomes or subsidies we need to increase affordability and efficiency so households can satisfy their basic needs consuming fewer resources and spending less money. Our planning should be guided by a new goal: how can we help families be poor but happy.”
I share this article because it provides a more complete narrative and assessment than those just focusing on transport. Home choice locations and affordable housing are part of the equation. Looking at transport alone can be myopic and leads us to think it is the only problem to solve.
–
Are transportation issues election issues in the Philippines?
Are transportation issues in the Philippines? Or are these issues at the local level? Here is an article about how transportation issues were brought to light and were actual topics in the ballot in Los Angele, California in the US:
Tu, M. (November 25, 2024 ) “Bike, Bus and Pedestrian Improvements Won the Vote in L.A. How Did Advocates Pull It Off? “ Next City, https://nextcity.org/urbanist-news/bike-bus-pedestrian-improvements-healthy-streets-los-angeles-ballot?utm_source=Next+City+Newsletter&utm_campaign=532838ef65-DailyNL_2024_11_18_COPY_01&utm_medium=email&utm_term=0_fcee5bf7a0-532838ef65-44383929 [Last accessed: 11/26/2024]
The three lessons in the article are:
- Build a coalition – “In the lead-up to the election in March, Streets For All successfully secured endorsements from unions, climate organizations and business groups that saw the vision for safer streets.”
- Safety wins – “We could make climate arguments, we could make equity arguments, but the thing that felt the most bulletproof to us and the most empathetic to the general Angeleno was just road safety,”
- Keep it simple – “…simple messages were the most effective. Vredevoogd fought for one billboard on Vermont Avenue that read “In 2022, more pedestrians died on Vermont Avenue than in the state of Vermont.”
Los Angeles or LA as many people fondly call the city is well known for being car-centric (as opposed to San Francisco to the north, which is more transit-oriented). Perhaps we can learn from this experience though I know there are already groups and coalitions lobbying for better transportation in the Philippines. Are they successful and to what extent are they succeeding? Granted there are different situations and conditions, even modalities, to engage politicians, there are also so-called party list groups claiming to represent the transport sector but none appear to be really standing up for issues like improving public transport or road safety. And so the challenge is still there for people to make transportation issues election issues in the country.
–
On the future of transportation – some history lessons
I found this interesting article that basically is a history lesson on transportation systems and infrastructure:
Dillard, G. (October 21, 2024) “Our infrastructure is Not Our Destiny,” Medium.com, https://medium.com/the-new-climate/our-infrastructure-is-not-our-destiny-6d7f8355144a [Last accessed: 11/17/2024]
To quote from the article:
“We’ll never build out a network of electric-car charging stations, they say, or How could we possibly replace all of these highways with mass transit? But the infrastructure that dominates our world today once seemed impossible, until it didn’t…
As we begin to imagine a new way of organizing our economy, let’s remember that infrastructure isn’t destiny, nor is it forever. Today, our fossil-fuel present may feel like the only “practical” way to do things — just as the canals, and then the railroads, once felt like the only possibility.
So the next time a transition away from cars, fossil fuels, and the other technologies that dominate our world seems impossible, think about Hermon Bronson and Robert Fulton, who surely thought that canals were the infrastructure of the future. They were wrong, and so are the people who tell us that it’s impossible or impractical to build a greener world.”
Perhaps we can take a look at our transportation infrastructure development history and the way it’s going now. It would be good to contextualize all those planned tollways and inter-island bridges against what is really most urgent these days (i.e., mass transit, active transport for our rapidly growing cities). I’ve always stated here about how some infra are nice to have but aren’t as urgent as others that need more push and support and will be utilized by and benefit more than fewer people.
–
On the general benefits of public transportation
Here’s another good read that has links to the outcomes of studies pertaining to public transportation’s direct and indirect effects on vehicle miles traveled or VMT (in our case we use vehicle kilometers traveled or VKT):
McCahill, C. (November 12, 2024) “The benefits of transit extend well beyond transit riders,” State Smart Transportation Initiative, https://ssti.us/2024/11/12/the-benefits-of-transit-extend-well-beyond-transit-riders/ [Last accessed: 11/20/2024]
To quote from the article:
“…good transit has a ripple effect on land use and travel behavior. For every mile not driven by transit riders, transit accounts for another six to nine miles not driven among the larger population. “
Note the potential reduction in VKT’s attributed to mass transportation or transit.
–
Increase in parking rates at NAIA
A friend shared this notice about the increase in parking rates at NAIA.
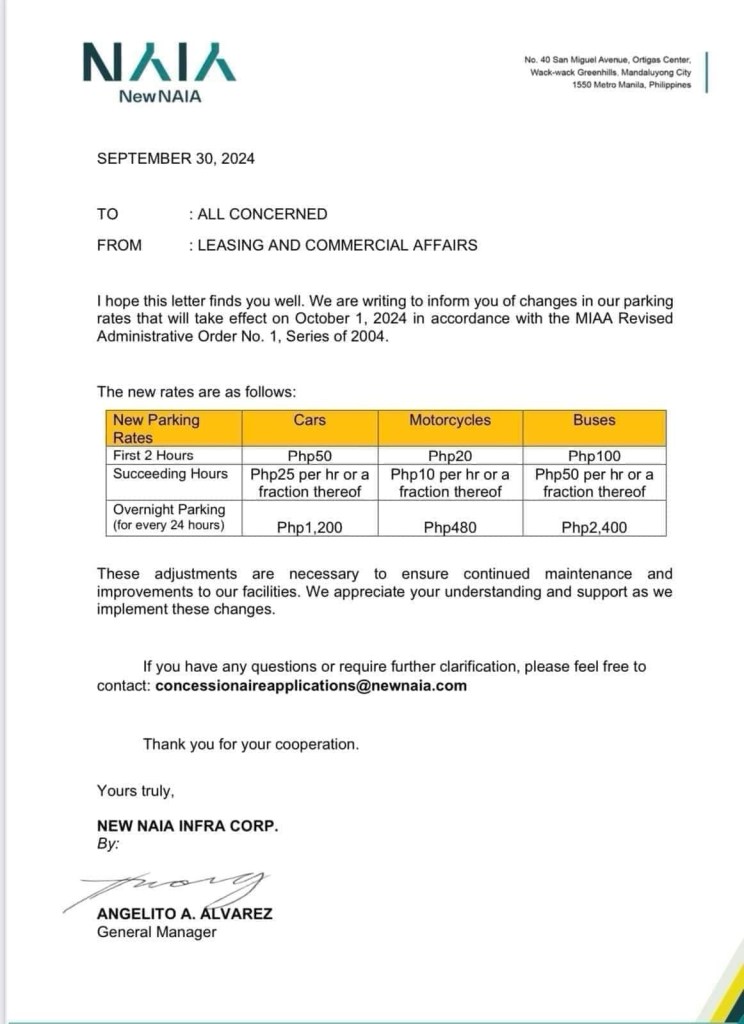
Parking at any of the terminals has been quite difficult if not horrendous. Everyone seems to be bringing their car to the airport for pick up and drop offs as well as leaving them for a night or more while traveling abroad or somewhere in the country. And then there are those who park there because the rates are supposed to be cheaper than the hotels and mall around the airport (e.g., the case of Terminal 3). Will the increase in the rates discourage unwanted or unnecessary parking? Perhaps not because people are still quite dependent on cars as their primary mode in and out of NAIA.
Access to the airport remains road-dependent. Granted there are many options like ride hailing, airport bus and taxis, these are all road based. They share the same roads that are often congested. The tollways are not enough to ease traffic in the area, which aside from airport generated trips include those from offices and industries in the area.
Too long has the need for a rail access for the terminals and government has failed to provide it. It would at least have engaged private sector for this provision but it took so long. Perhaps the Metro Manila subway will change that but we have to wait a long while to find out.
–
On transportation and global health – article share
I was supposed to write about the keynote lecture delivered during the 30th Annual Conference of the Transportation Science Society of the Philippines (TSSP). I am sharing instead an article written by Dr. Renzo Guinto who is an Associate Professor at the SingHealth Duke-NUS Global Health Institute based at the National University of Singapore.
Here is the link to his article on the Philippine Daily Inquirer: Health at the center of transport and mobility
I will not quote from the article and leave it to my readers to read and appreciate the articles content.
–
Technical sessions at the TSSP 2024 Conference
I am sharing here the latest draft of the technical sessions for the 30th Annual Conference of the Transportation Science Society of the Philippines (TSSP). The conference will be held in Iloilo City this coming September 13, 2024.
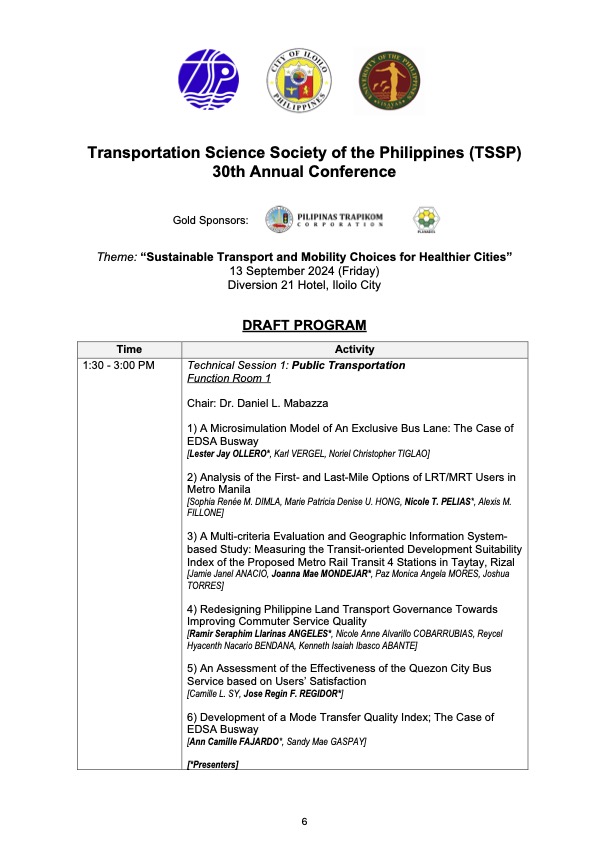
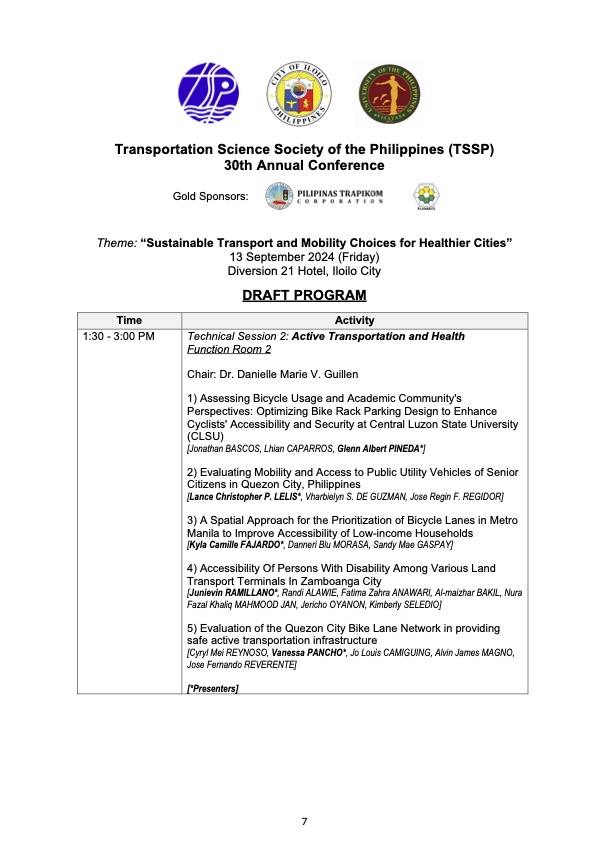
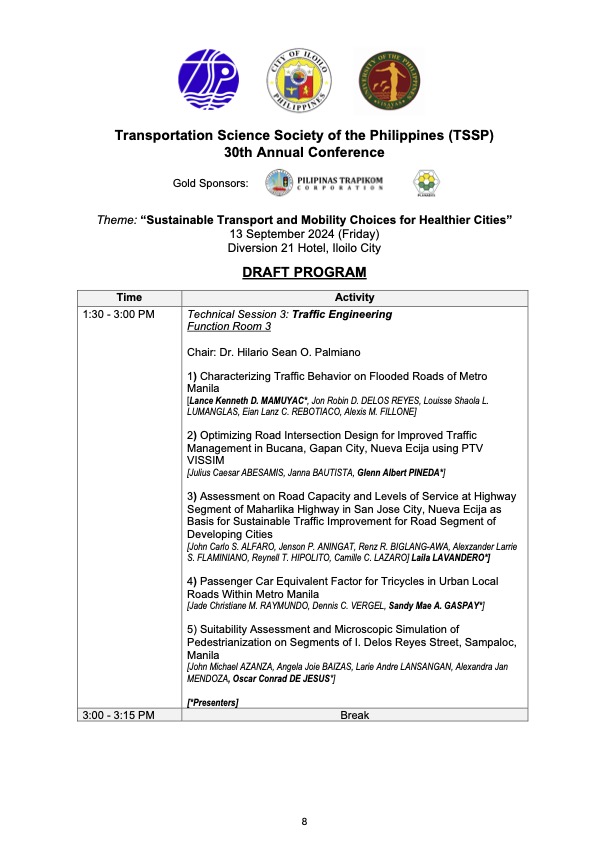
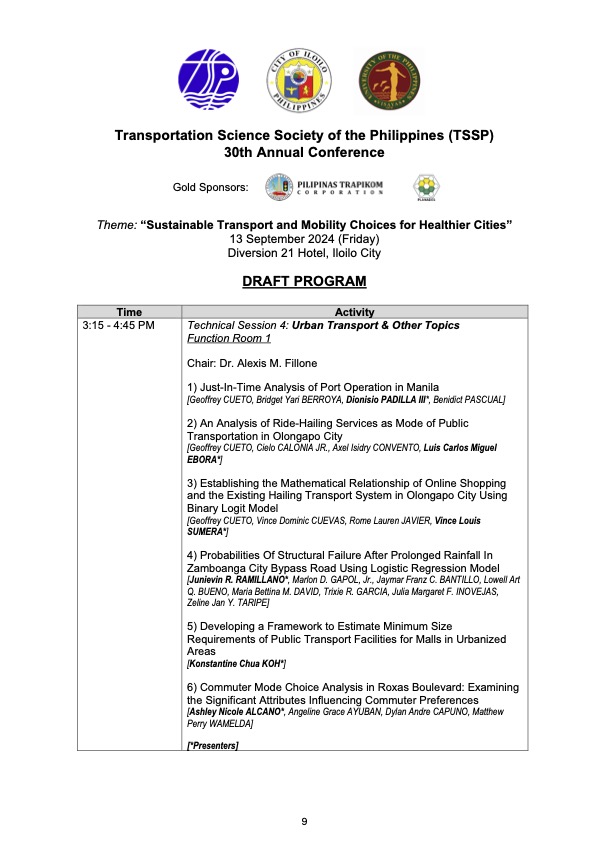
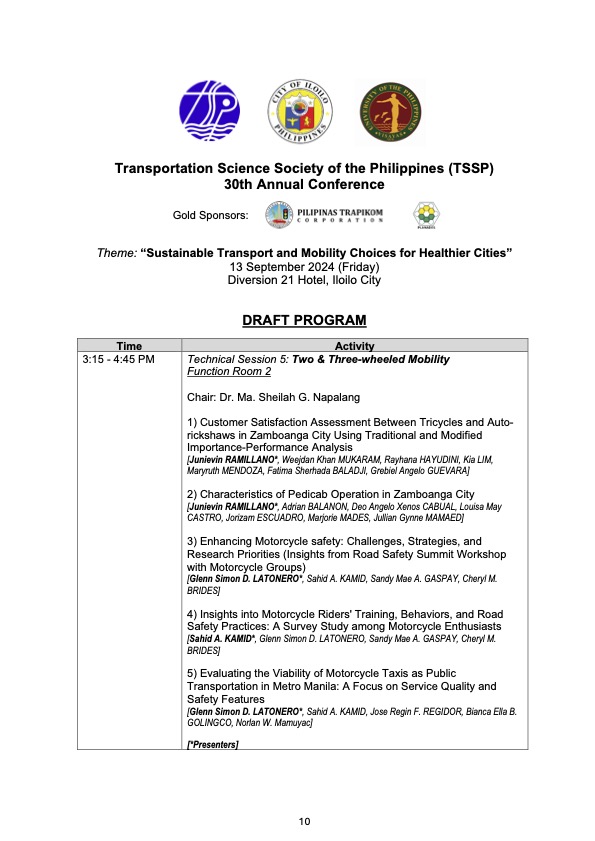
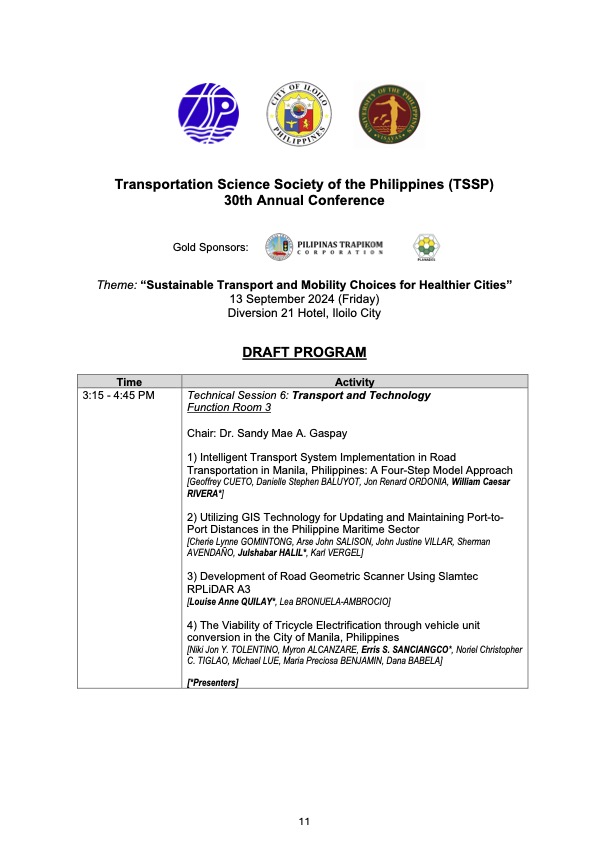
I will share the draft program for the morning plenary session in the next post.
–
