
Home » Posts tagged 'active transport' (Page 2)
Tag Archives: active transport
Planning for True Transportation Affordability: Beyond Common Misconceptions
How much do we spend on transportation as part of our budgets? Is it 5% of your monthly budget? Is it 10%? Or is it eating up a substantial part of what you’re earning?
Source: Planning for True Transportation Affordability: Beyond Common Misconceptions
To quote from the article:
“This research indicates that many common policies favor expensive transportation and housing over lower-cost alternatives, which drives the cost of living beyond what is affordable, leaving too little money to purchase other necessities. The result is immiseration: growing stress, unhappiness, and discontent.
The solution is simple: planning should favor affordable over expensive modes and compact development over sprawl. This is not to suggest that automobile travel is bad and should be eliminated. Many people are justifiably proud of being able to afford a nice car, and automobiles are the most efficient option for some trips. However, automobile travel requires far more resources and is far more expensive than other modes, typically by an order of magnitude, so true affordability requires an efficient, multimodal transportation system that allows travelers to choose the options that truly reflect their needs and preferences.
Affordability requires a new economic paradigm; rather than trying to increase incomes or subsidies we need to increase affordability and efficiency so households can satisfy their basic needs consuming fewer resources and spending less money. Our planning should be guided by a new goal: how can we help families be poor but happy.”
I share this article because it provides a more complete narrative and assessment than those just focusing on transport. Home choice locations and affordable housing are part of the equation. Looking at transport alone can be myopic and leads us to think it is the only problem to solve.
–
On whether bike lanes cause more traffic congestion
I previously share articles on whether bike lanes cause more traffic. This question has been asked so often as we have returned to the “old normal” levels of traffic and bike lanes that were put up during the pandemic have been neglected or removed in favor of motor vehicle traffic. The perception for those in-charge of traffic and transportation in local government units is that the space occupied by bike lanes take up the space demanded by motor vehicle use. Thus, the view that bike lanes cause congestion. Here is another article share in support of bike lanes:
Mortillaro, N. (October, 2024) “Do bike lanes really cause more traffic congestion? Here’s what the research says,” cbc.ca, https://www.cbc.ca/news/science/bike-lanes-impacts-1.7358319 [Last accessed: 01/11/2024]
To quote from the article:
“One would think that building more roads with more lanes for cars would reduce congestion, but research shows that’s not the case, thanks to something called induced demand. The more traffic lanes that are put in, the more it appeals to people who may not otherwise have chosen to drive, thereby putting more cars on the roads and increasing congestion.
“So for a short period of time, there might be a slightly improved [reduction], but within a year or two, or perhaps three, traffic is as bad or worse than it was before the lanes were added in the first place,” said David Beitel, data services lead at Eco-Counter, a Montreal company that collects and analyzes pedestrian and bicycle traffic data.
Conversely, if you put in more dedicated bike lanes, people tend to feel safer and demand for use increases, said Shoshanna Saxe, an associate professor at the University of Toronto’s department of civil and mineral engineering and Canada Research Chair in sustainable infrastructure.
“As soon as you build a bike lane, within a year, two years, the latent demand shows up,” she said.
Bike Share Toronto statistics show that ridership on its network of shared bikes has increased dramatically since 2015, when 665,000 bike trips were made annually. In 2023, that shot up to 5.7 million trips.”
I think many people here are already aware of the concept of induced demand. However, this is usually shrugged aside as realities in their situations (e.g., commuting options, locations of residences and workplaces, etc.) lead them to choosing private vehicles (i.e., cars and motorcycles) over public or active transport. The last paragraph there is significant though as there never was and so far a decent estimate of bike trips in any city in the Philippines. Granted that there are attempts to measure bike trips but the volumes published so far are not as reliable as we want them to be in order to be convincing decision-makers to put up more bike lanes. Of course, the convincing part is always challenging if decision-makers have already made up their minds in favor of the car.
–
Designing a “Runnable” City
I’m sure you’ve read or heard about walkable cities. But have you read or heard about “runnable” ones? Here’s a quick share of an article about cities where you can run, jog or walk.
Source: Designing a “Runnable” City
To quote from the article:
“Several urban design principles can enhance the runnability of a city:
Connectivity and accessibility: This means developing a network of interconnected running paths and trails that are easily accessed from various parts of the city (especially neighborhoods). Even better if can be green corridors that connect to other parks and open spaces, and support continuous movement.
Safety and security: Ensuring running paths are well-lit and separated from vehicle traffic is crucial. Traffic calming measures such as vehicle lane narrowing, wider footpaths, and appropriate landscaping enhance runner safety. Street trees also help reduce car speeds, as they alter our perception of how wide the road is and provide a psychological cue that we’re in a residential area. Redesigning urban infrastructure to include dedicated running paths alongside walking paths and bicycle lanes, is a great idea.
Inclusive design: City design should encourage active mobility, which means including benches, water fountains, and restrooms along running routes. It means building footpaths that enables running, and avoiding uneven, slippery or unfavorable surfaces such as cobblestones. It also means making it easy to find your way around — even in unfamiliar environments.”
–
Technical sessions at the TSSP 2024 Conference
I am sharing here the latest draft of the technical sessions for the 30th Annual Conference of the Transportation Science Society of the Philippines (TSSP). The conference will be held in Iloilo City this coming September 13, 2024.
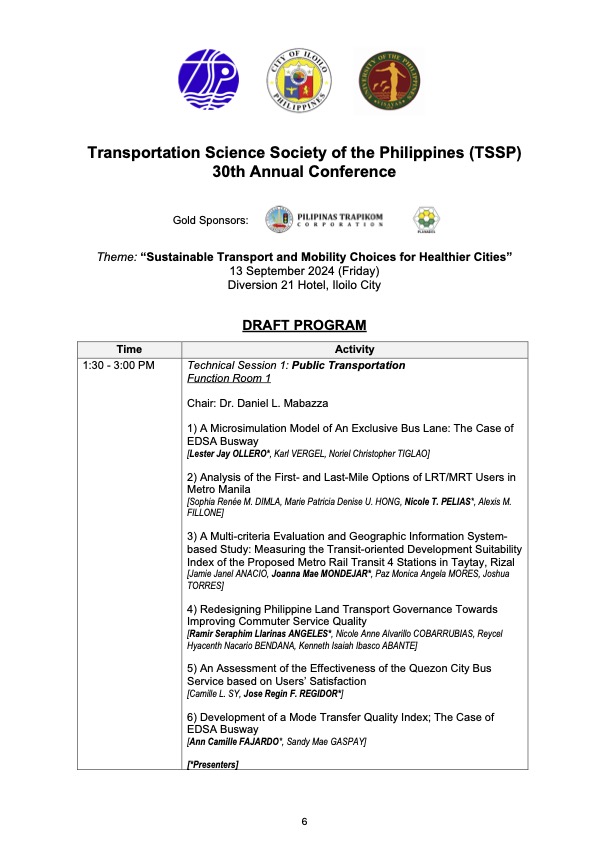
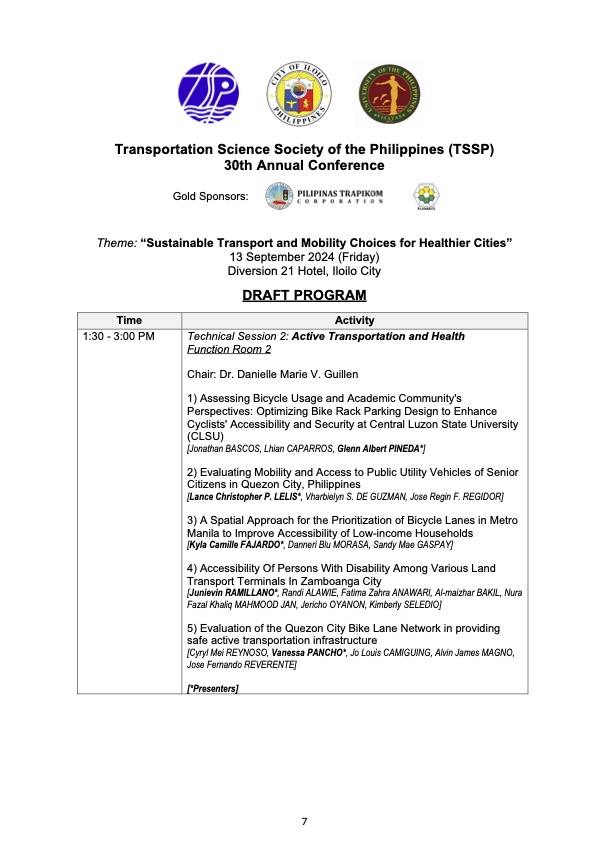
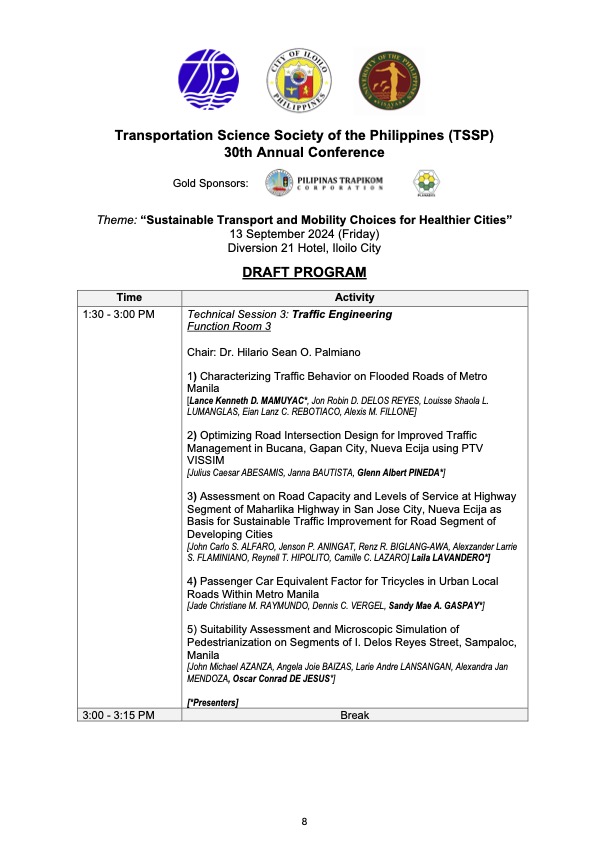
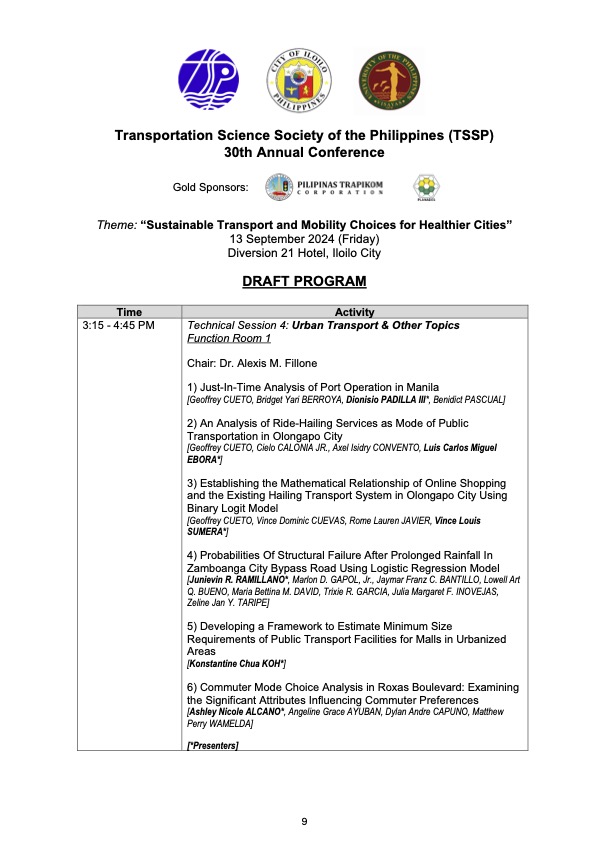
I will share the draft program for the morning plenary session in the next post.
–
On mountain biking and its history
Here is another quick share of a rather informative and amusing article about cycling, particularly about mountain-biking:
Septer, Q. (June 29, 2024) “The Poetry of Cycling,” Medium.com, https://medium.com/the-new-outdoors/the-poetry-of-cycling-dffeb752b510 [Last accessed: 8/24/2024]
To quote from the article:
“Mountain biking continues to ascend in popularity. New trails are built. New records are set. New technologies are fine-tuned to the subtleties of the sport’s sub-disciplines. But the ethos of mountain biking hasn’t changed all that much since the days of the Buffalo Soldiers, more than a century ago, when folks simply wondered how far a bicycle might take them.”
–
Pedestrian-Friendly Cities: The Impact of Walkability Grants
Here is a quick share of an article on how to encourage cities to be more pedestrian-friendly:
Source: Pedestrian-Friendly Cities: The Impact of Walkability Grants
Many of our cities, particularly the highly urbanized ones, are not as walkable as we want them to be. Lacking are the most basic facilities such as sidewalks and safe crossings. Walkability Grants such as those in the US can encourage cities to build and/or enhance pedestrian infrastructure. Many designs such as those footbridges along EDSA and Commonwealth Avenue, for example, are anti-walking. Grants may be used to come up with better designs for walkways and footbridges.
To quote from the article:
“Walkability grants are awards for programs and projects creating innovative pedestrian infrastructure, such as new sidewalks, crosswalks, plazas, street lights and green spaces. For example, in February 2023, the Biden-Harris Administration announced the Safe Streets and Roads for All Grant Program, delivering $800 million in monetary awards for 511 projects addressing public safety and road improvements…
Reshaping the built environment into a walkable haven helps boost the local economy and sustainability. By changing the urban landscape, citizens are more inclined to walk instead of drive, allowing cities to reduce emissions, improve air quality and create healthier neighborhoods. This is critical, considering air pollution is responsible for 7 million early deaths yearly.”
Perhaps we can have similar grants coming from national government via the Department of Interior and Local Government (DILG) in cooperation with the Department of Transportation (DOTr) and the Department of Public Works and Highways (DPWH)? There was some funding for bikeways during the pandemic but this new one should put more emphasis on walkability.
–
Article share: on how transportation impacts your health
I’ve written or shared articles here about transportation and health. I share another article concerning how transportation impacts our health. Here’s our first article share this August:
Harris, A. (August 1, 2024) “Getting there is half the battle: how transportation impacts your health,” The Flint Courier News, https://theflintcouriernews.com/getting-there-is-half-the-battle-how-transportation-impacts-your-health/ [Last accessed: 8/14/2024]
To quote from the article:
“In health, transportation is essential to how people access health care and maintain health,
whether it is getting to the doctor, picking up medication from the pharmacy, going to the
grocery store to maintain nutritional needs, or walking around their neighborhood to get more
exercise.”
–
On a city’s part in making bike and scooter shares succeed
I recently posted about Bonifacio Global City (BGC) and the bike and scooter share they have there. There was one bike share there and in the Ortigas Center before the pandemic. But those fizzled out for various reasons including not so many people using it. Here’s a report on bike and scooter shares in the US and the observation that cities are not making it easy for these to succeed:
Tu, M. (July 29, 2024) “Report: People Want to Ride Shared Bikes and Scooters, But Cities aren’t Making it Easy,” Next City [Last accessed: 8/2/2024]
To quote from the article:
“Even long standing bike share systems can fall victim to the whims of leaders who are not committed to investing in greener modes of transportation. Houston recently lost its bike share system, ending 12 years of operations for BCycle after a new mayor hostile to bike and pedestrian improvements overhauled the METRO Houston board.
If cities want to encourage people to ride a bike or scooter instead of getting into a car, they will have to figure out how to fund it — or in other words, put their money where their carbon reduction goals are.”
Though we’re still a long way to achieving the bike and scooter shares they have in other countries such as the US, we should be wary about their experiences. The lessons learned here should already be in mind to those who will be setting up bike and/or scooter shares in Philippine cities. There is a demand for these facilities as people find cycling convenient and safer in some cities. However, LGUs need to invest more and commit to safer and more connected bicycle facilities in order to convince more people to use this active transport mode instead of motorized transport including motorcycle taxis.
–
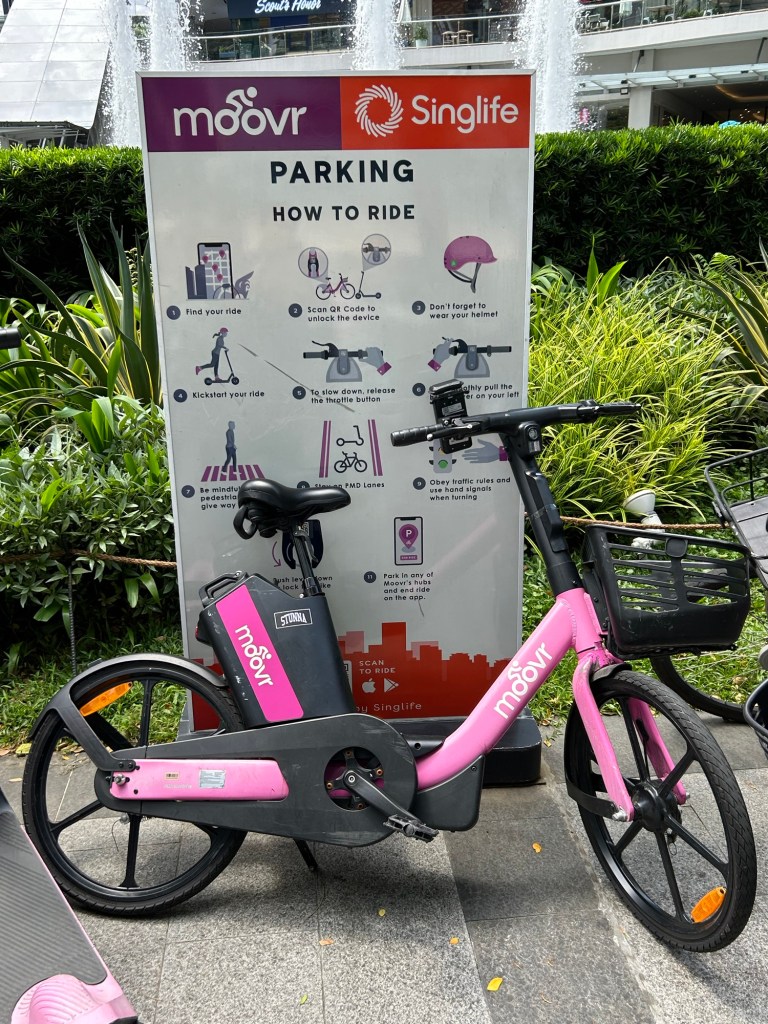
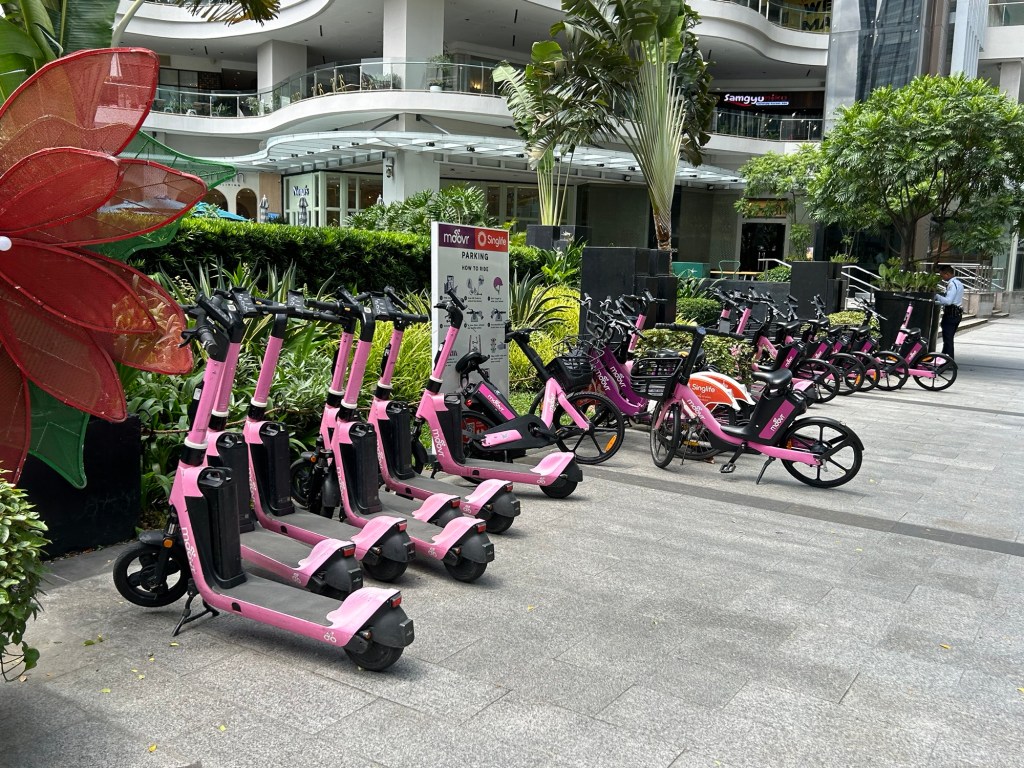
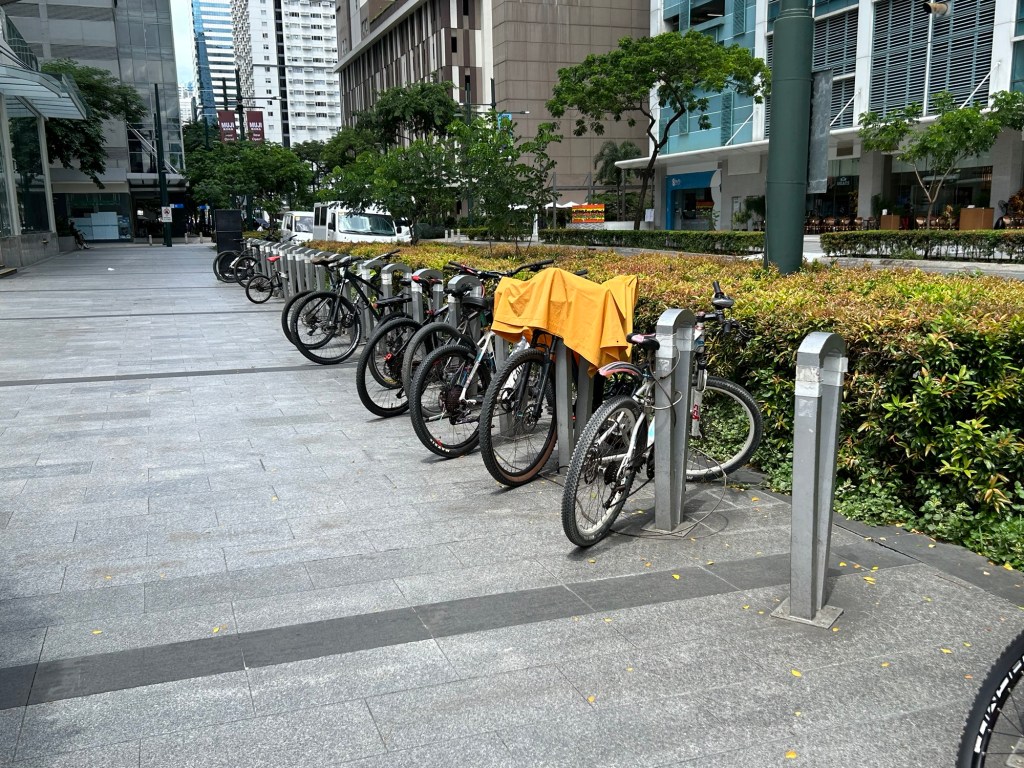
Mobility options in BGC
I haven’t been to Bonifacio Global City (BGC) in Taguig in a while. Unlike before (during the pandemic) when we could just stay at the condo some days to chill at our unit and explore BGC for lunch or dinner. We have high speed internet at our condo unit so we can work from there. I can do my lectures via Zoom and the wife could have her meetings online. Fast forward and we decided to have our unit leased so we couldn’t go there as frequently as before. The lease ended last month and we’re using the condo unit for ourselves while we refurbish the unit for future use, whether for our purposes or for leasing again.
It’s good to know that there are now active transport options for going around BGC. The previous bike share closed shop before the pandemic and it took a while for moovr to set up. Here are a few photos of the station near our condo.
–
SPRINT principles for bicycles
Here is the link to how to improve your city’s or municipality’s bicycle facilities based on scores guided by the SPRINT principles: https://cityratings.peopleforbikes.org/create-great-places
SPRINT stands for:
S -Safe Speeds
P-Protected Bike Lanes
R-Reallocated Space
I-Intersection Treatments
N-Network Connections
T-Trusted Data
The site provides links and examples of good practices of actual bike projects in the US. Many of these can be replicated or adapted to Philippine conditions. These are something that the active transport section of the Department of Transportation (DOTr) should look into and perhaps provide a reference for developing and improving bicycle facilities in the country.
–
