
Home » Posts tagged 'mode choice'
Tag Archives: mode choice
Still towards a car-oriented future?
Saw this photo being circulated on social media.
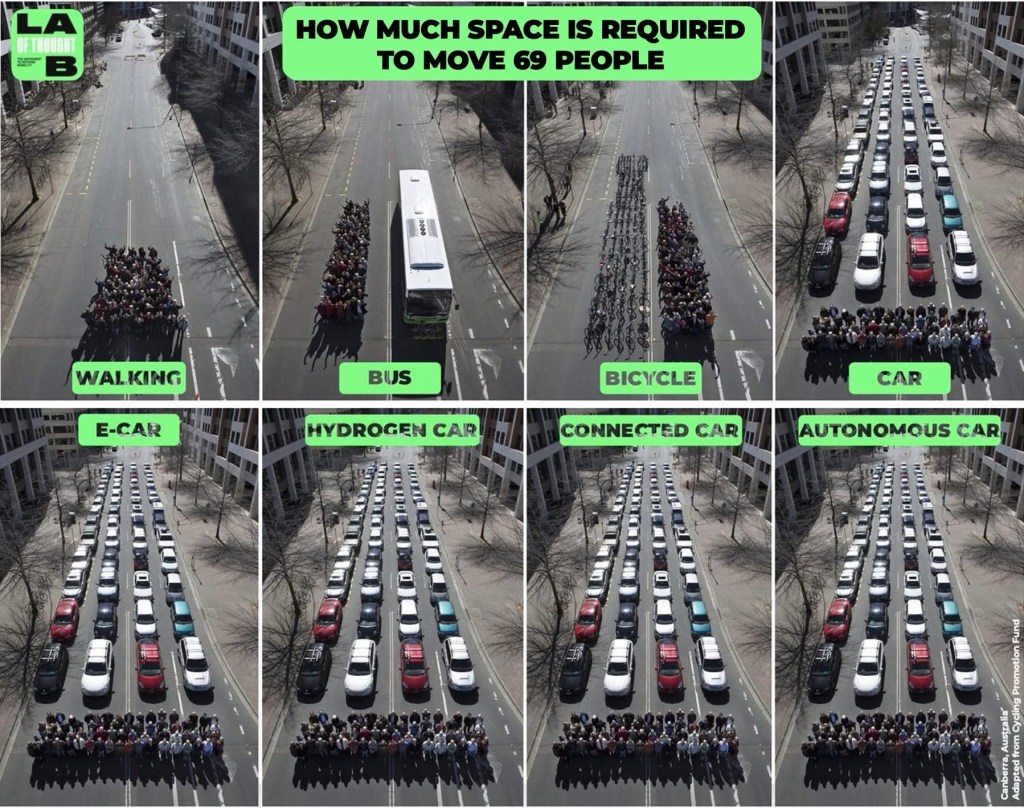
Again, there are many versions of this including the original from a town in Germany that compared 50 people on cars, a bus and on bicycles. The bottom line in the latest images (do these qualify as memes?) is that all these efforts in developing the car, whether regarding the engine or fuel, or perhaps autonomy or connectivity related, ends up being still car-oriented or car-centric. I
t doesn’t really solve our transport problems despite what is being packaged as environmentally friendly. The discussions about this is timely and relevant as electric and hybrid cars are now quickly replacing conventional ones. And there’s a kicker for those driving in Metro Manila, hybrid and electric vehicles are exempted from the travel demand management scheme that is number coding.
How do we veer away from this temptation from technology? How do we keep mode shares in favor of active and public transportation? How do we influence mode choice for the latter options?
–
Planning for True Transportation Affordability: Beyond Common Misconceptions
How much do we spend on transportation as part of our budgets? Is it 5% of your monthly budget? Is it 10%? Or is it eating up a substantial part of what you’re earning?
Source: Planning for True Transportation Affordability: Beyond Common Misconceptions
To quote from the article:
“This research indicates that many common policies favor expensive transportation and housing over lower-cost alternatives, which drives the cost of living beyond what is affordable, leaving too little money to purchase other necessities. The result is immiseration: growing stress, unhappiness, and discontent.
The solution is simple: planning should favor affordable over expensive modes and compact development over sprawl. This is not to suggest that automobile travel is bad and should be eliminated. Many people are justifiably proud of being able to afford a nice car, and automobiles are the most efficient option for some trips. However, automobile travel requires far more resources and is far more expensive than other modes, typically by an order of magnitude, so true affordability requires an efficient, multimodal transportation system that allows travelers to choose the options that truly reflect their needs and preferences.
Affordability requires a new economic paradigm; rather than trying to increase incomes or subsidies we need to increase affordability and efficiency so households can satisfy their basic needs consuming fewer resources and spending less money. Our planning should be guided by a new goal: how can we help families be poor but happy.”
I share this article because it provides a more complete narrative and assessment than those just focusing on transport. Home choice locations and affordable housing are part of the equation. Looking at transport alone can be myopic and leads us to think it is the only problem to solve.
–
On whether bike lanes cause more traffic congestion
I previously share articles on whether bike lanes cause more traffic. This question has been asked so often as we have returned to the “old normal” levels of traffic and bike lanes that were put up during the pandemic have been neglected or removed in favor of motor vehicle traffic. The perception for those in-charge of traffic and transportation in local government units is that the space occupied by bike lanes take up the space demanded by motor vehicle use. Thus, the view that bike lanes cause congestion. Here is another article share in support of bike lanes:
Mortillaro, N. (October, 2024) “Do bike lanes really cause more traffic congestion? Here’s what the research says,” cbc.ca, https://www.cbc.ca/news/science/bike-lanes-impacts-1.7358319 [Last accessed: 01/11/2024]
To quote from the article:
“One would think that building more roads with more lanes for cars would reduce congestion, but research shows that’s not the case, thanks to something called induced demand. The more traffic lanes that are put in, the more it appeals to people who may not otherwise have chosen to drive, thereby putting more cars on the roads and increasing congestion.
“So for a short period of time, there might be a slightly improved [reduction], but within a year or two, or perhaps three, traffic is as bad or worse than it was before the lanes were added in the first place,” said David Beitel, data services lead at Eco-Counter, a Montreal company that collects and analyzes pedestrian and bicycle traffic data.
Conversely, if you put in more dedicated bike lanes, people tend to feel safer and demand for use increases, said Shoshanna Saxe, an associate professor at the University of Toronto’s department of civil and mineral engineering and Canada Research Chair in sustainable infrastructure.
“As soon as you build a bike lane, within a year, two years, the latent demand shows up,” she said.
Bike Share Toronto statistics show that ridership on its network of shared bikes has increased dramatically since 2015, when 665,000 bike trips were made annually. In 2023, that shot up to 5.7 million trips.”
I think many people here are already aware of the concept of induced demand. However, this is usually shrugged aside as realities in their situations (e.g., commuting options, locations of residences and workplaces, etc.) lead them to choosing private vehicles (i.e., cars and motorcycles) over public or active transport. The last paragraph there is significant though as there never was and so far a decent estimate of bike trips in any city in the Philippines. Granted that there are attempts to measure bike trips but the volumes published so far are not as reliable as we want them to be in order to be convincing decision-makers to put up more bike lanes. Of course, the convincing part is always challenging if decision-makers have already made up their minds in favor of the car.
–
On congestion due to school drop-offs
I found this rather interesting article about congestion at school drop-offs in the US:
Hurley, K. (September 16, 2024) “How School Drop-Off Became a Nightmare,” The Atlantic, https://www.theatlantic.com/family/archive/2024/09/school-drop-off-cars-chaos/679869/?utm_source=copy-link&utm_medium=social&utm_campaign=share [Last accessed: 9/26/2024]
To quote from the article:
“Today, more parents in the United States drive kids to school than ever, making up more than 10 percent of rush-hour traffic. The result is mayhem that draws ire from many groups. For families, the long waits are at best a stressful time suck and at worst a work disruptor. Some city planners take the car line as proof of our failure to create the kind of people-centered neighborhoods families thrive in. Climate scientists might consider it a nitrogen-oxide-drenched environmental disaster. Scolds might rail at what they see as helicopter parents chaperoning their kids everywhere. Some pediatricians might point out the health threats: sedentary children breathing fumes or at risk of being hit by a car.”
The situation described in the article is actually already happening for quite a long time now in the Philippines and mostly at private schools. You have the same issues with the traffic congestion and road safety risks faced by schoolchildren in schools like Ateneo and LaSalle. The more ‘elite’ public schools like the science high schools may also have similar concerns. Can these be really addressed at the local level or is there a deeper, more complicated problem that needs to be tackled here (just to clarify that my questions are for our case here in the Philippines and not in the US)?
–
When Driving Isn’t an Option: Steering Away From Car Dependency
Here is another quick share of an article from Planetizen. The article relates about people who cannot drive so driving for them is not an option:
Source: When Driving Isn’t an Option: Steering Away From Car Dependency
Quoting from the article:
“Zivarts shows that it is critical to include people who can’t drive in transportation planning decisions. She outlines steps that organizations can take to include and promote leadership of those who are most impacted—and too often excluded—by transportation systems designed by and run by people who can drive. “
There are actually many who can drive and who would like not to drive but then opt to drive because of limited and inconvenient or uncomfortable options. I think government agencies and local government units are supposed to work on this but like people who try to ‘solve’ traffic by isolating it from other factors such as housing, they ultimately gain little ground if not fail. It doesn’t help that the decision makers such as government officials and politicians drive or are driven. Of course, there is still such a thing as empathy so let’s not discount those who do use cars for their commutes but also work hard to improve transportation. It’s just that such people are rare these days and may not be in a position to move things to enable significant improvements to the transportation system.
–
Ownership is not equal to use – on bike ownership in the Philippines
There is a nice graphic going around social media about bicycle and vehicle ownership in the Philippines. It is attributed to the Social Weather Stations (SWS), which conducted a survey on vehicle ownership in the country during the first quarter of 2023. Most conspicuous is the inclusion of bicycles considering that past national surveys (especially those conducted by the PSA or NSA) did not include bicycles but only motor vehicles in their surveys.
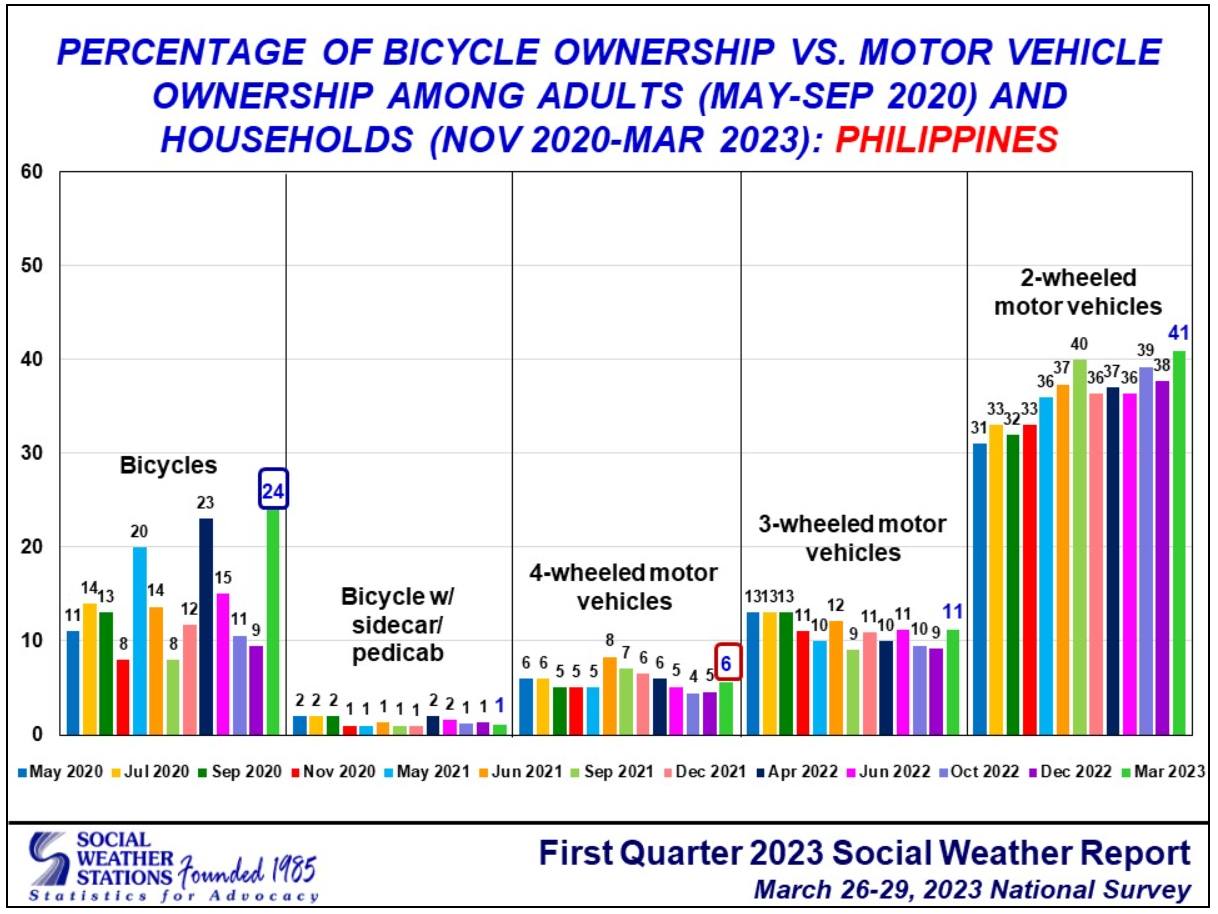
The graph shows many households owning bicycles (24% as of Mar 2023) while those who owned 4-wheel motor vehicles are only at 6%. The quick conclusion I see in many social media posts is that only 6% of HH use cars and that 24% use bicycles. This is actually fallacious and therefore misleading. Such assessments and conclusions is far from being factual considering ownership in this case does not necessarily translate to use, particularly for the most important trips made during the day – commutes to work and school. In other words, a household owning at least one bicycle does not mean they use it for their regular commutes.
The graph also states that the data is for the entire country. Thus, it does not give us a more accurate take for cities, particularly the highly urbanized ones. Are the % the same for cities like those in Metro Manila? How were the samplings conducted? These are important because if we have the wrong data and assumptions, we won’t be able to understand the problem at hand. We will not be able to formulate the most suitable solutions to address the transport problems we are experiencing. On the part of SWS, they should be clarifying what the data means rather than be content of people using their data to mislead or peddle narratives for advocacies that may be worthy yet use misinformation as a means to an end.
–
Article share: On the benefits of sidewalk networks
Here is another quick share of an article by Todd Litman on Planetizen. The article contains a lot of information or data about why we should be investing in sidewalks or pedestrian facilities (i.e., for walking).
Litman, T. (August 6, 2023) “Completing Sidewalk Networks: Benefits and Costs,” Planetizen, https://www.planetizen.com/blogs/124999-completing-sidewalk-networks-benefits-and-costs?utm_source=newswire&utm_medium=email&utm_campaign=news-08142023&mc_cid=cd3b2e2ba5&mc_eid=9ccfe464b1 [Last accessed: 9/23/2023]
To quote from the article:
“Walking is the most basic and universal travel mode, and sidewalks are the most basic walking infrastructure, but they are often overlooked and undervalued in transportation planning. Completing and improving sidewalk networks can help achieve many economic, social and environmental goals.
Recent case studies indicate that typical North American communities spend $30 to $60 annually per capita on sidewalks, and would need to double or triple these spending levels to complete their networks. This is a large increase compared with current pedestrian spending but small compared with what governments and businesses spend on roads and parking facilities, and what motorists spend on their vehicles. Sidewalk funding increases are justified to satisfy ethical and legal requirements, and to achieve various economic, social and environmental goals. There are several possible ways to finance sidewalk improvements. These usually repay their costs thorough savings and benefits.”
–
Short cuts in Zamboanga City
Our capacity building workshop in Zamboanga involved not just lectures and workshops but some practical exercises to demonstrate the surveys needed for road safety assessment of schools. Fortunately, there was a nearby school to our workshop venue and we only needed to walk to the school where participants could set up at certain locations to simulate data collection. Since a couple of teachers participating in the workshop were from the area and the nearby school, they led us to a short cut to get to their school. The route included a walk along a paved path along one of Zamboanga City’s streams.
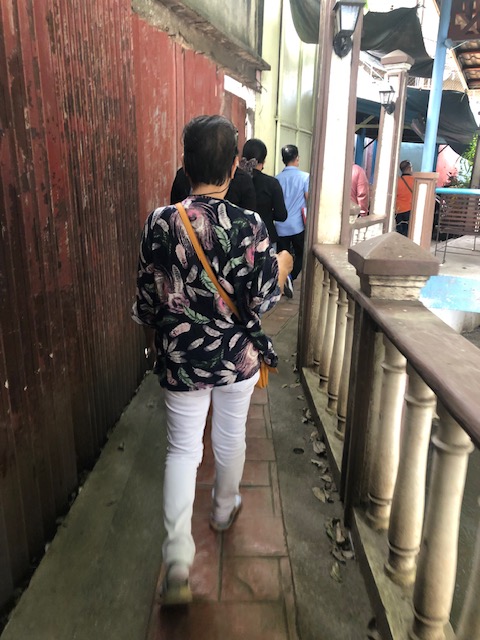
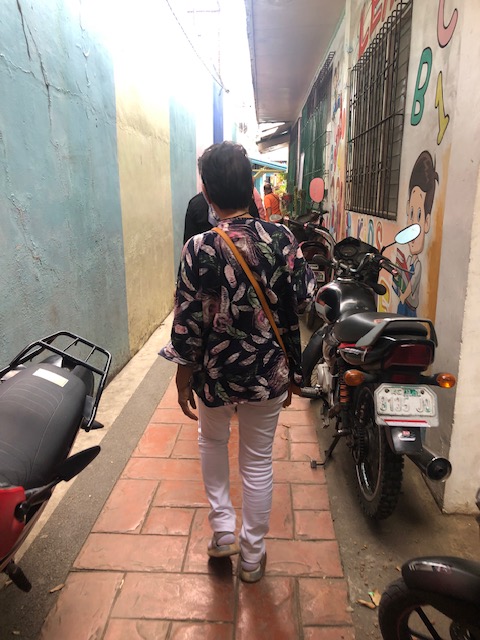
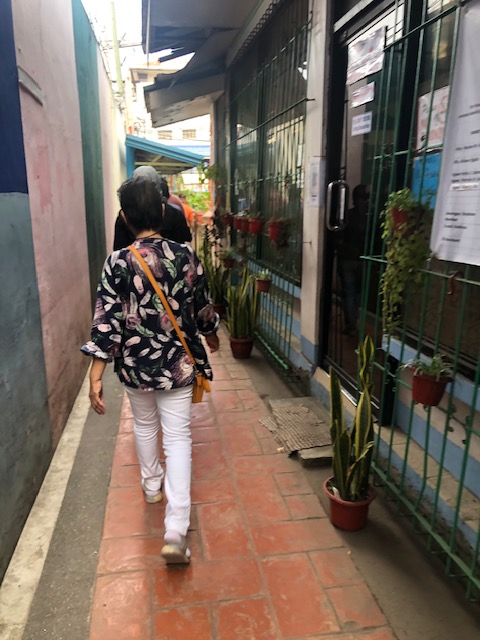
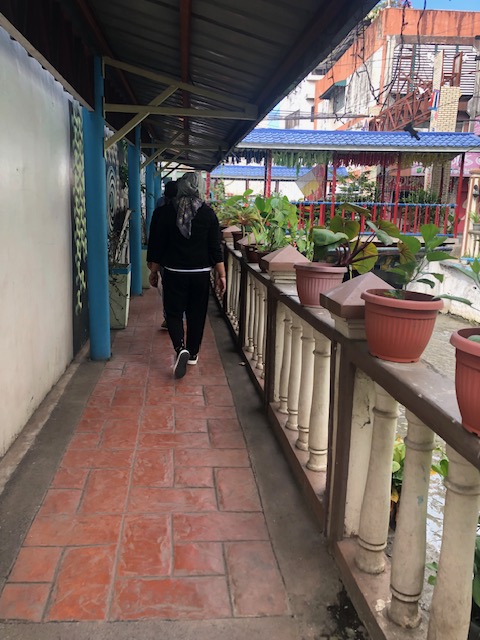
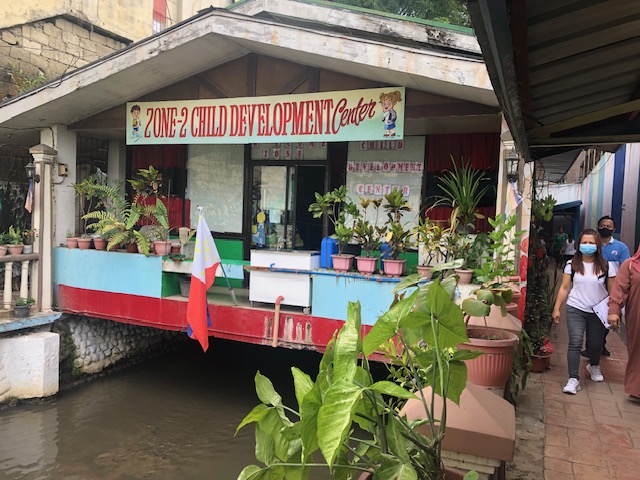
The area had a smell (stink?) to it. That was likely because it was the dry season and the heat meant the dirty water from the stream evaporated and generated the smell. There were even large rats that we saw swimming in the waters! Our guides told us that it was better during the wet season as the water flowed faster and was cleaner due to the rains and runoff. They also related about them bathing in the stream during their childhood days (I assume this was more than 30 years ago.) and before the structures above were constructed. The pathways were clean and secure though and there were others like these that we thought were good examples of pedestrian infrastructure that promote safety as well as encourage walking as a preferred mode of transport especially for short trips.
–
Article share: On a future with fewer cars
Advocates of sustainable transport including those pushing for more efficient public transport and more bike lanes often cite what is supposed to be car ownership data from past studies like the one conducted by JICA for Mega Manila. Most recently, I read an article that mentions only 5% of Filipinos own a car so they shouldn’t be hogging the road space against the rest. It seems so simple yet does not take into consideration geographic and demographic factors. It seems to underestimate vehicle ownership across the country and especially in cities. Also, do we equate vehicle ownership with just car ownership? Many may not have cars per se but own and operate motorcycles or tricycles.
I share the following article from the Washington Post as it presents on initiatives and studies from the Institute of Transportation Engineers concerning car ownership in the US. The data is presented in a way that we can clearly understand car ownership from various perspective including income level, household size, age and disability, among others.
Aratani, L. (February 18, 2023) “How a future with fewer cars may change how communities are designed,” Washington Post, https://www.washingtonpost.com/transportation/2023/02/18/automobile-ownership-street-design/ [Last accessed: 2/27/2023]
Here is an excerpt from the article: “There are people who are car-free and those who are carless. The car-free are the people who are choosing not to have a vehicle because they have access to other means of transportation or they work from home. The carless are people who either can’t afford or don’t have access to a car for other reasons.”
It would be nice to have a similar data set and analysis for the Philippines so we can really understand mode choice or preferences with respect to various factors including household income. Among the data sets we can probably use are the census data and the Family Income and Expenditure Survey (FIES) that are regularly collected and from which we can ascertain vehicle ownership vs. various parameters.
–
How my students see transport and traffic
With social media and the ascendance or popularity of influencers and the like, we have often encountered assessments or opinions about transportation and traffic. While there are those that make sense, there are more that are of the rant variety. The latter include the self-righteous who seem to relish bashing professionals and government officials while not being able to present much in terms of their own accomplishments. I am aware of my students (including research advisees) being aware of these people and I often see them posting their comments on topics, articles and opinions being shared on social media. For most, their comments and posts on social media show they’re being more informed than most, especially about the state of transportation in the country.
Here are some observations and comments from my students:
- One of my students asked me about my take on the public transport situation. I replied that it is unfortunate that public transportation has deteriorated the way it has for the past decades. The current state is not due to recent policies or regulations but a product of various policies, regulations and even trends over so many years. My student countered that perhaps the current officials must not make an excuse of the past in failing to act in the present.
- I always read about posts that anchor their arguments on the supposed low car ownership in Metro Manila. These are usually followed by calls for taking lanes away from car use for public transport and cycling. While I agree with the latter, I don’t with the former arguments. A student was curious about my statement in one lecture that we need to validate the numbers because what we see on the streets appears to be inconsistent with the notion of low car ownership. There are other ways, she said, to determine vehicle ownership other than the conventional HIS data. We could probably use the Family Income and Expenditure Survey (FIES) that is regularly conducted by the Philippines Statistics Authority (PSA). This will show if people own motor vehicles as well as how much they spend for transportation.
- I asked my students to critique the plans and implementation of airports in the Greater Capital Region (GCR) also known as Mega Manila, and which is larger than the NCR Plus used to refer to Metro Manila plus Bulacan, Rizal, Laguna and Cavite. I was not surprised about their assessments as all of them did their homework in the sense that they researched on information and data they could use for their critiques. Most were in favor of developing a new capital airport in Bulacan rather than in Cavite. And many favored the continued operation of NAIA but with reduced air traffic and a different role.
More on these opinions, observations and comments as I try to recall the more remarkable or notable ones.
Have a nice Sunday!
–
