
Home » Policy (Page 24)
Category Archives: Policy
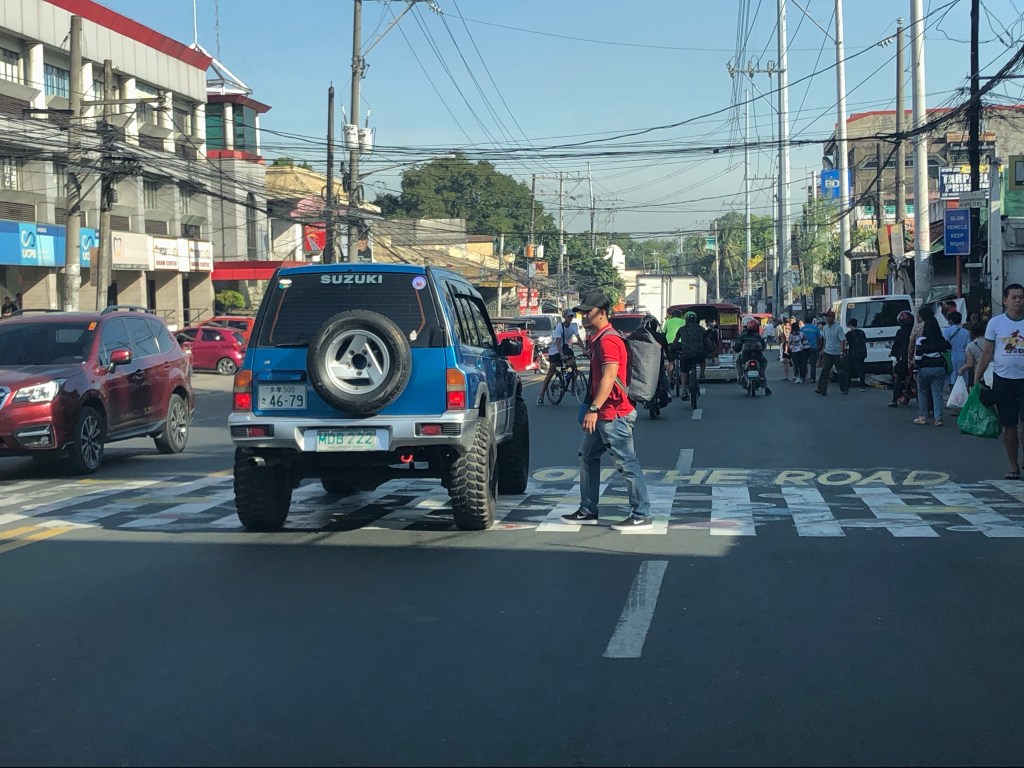
Whatever happened to those ‘enhanced’ pedestrian crossings?
Before the lockdowns, a lot of people seem to have become excited with what a private company did as part of their PR campaign (I’m certain about this because their ads feature these.). That is, they painted on the existing pedestrian crossings in Antipolo City along major roads such as Sumulong Highway and the Sumulong Memorial Circle. While coordination with the LGU was done, there seems to be none with the DPWH considering these are national roads and any matter concerning them are under the agency’s jurisdiction through their District Engineering Office. The following photos were taken prior to the lockdown and as you can see (if you were objective) there’s nothing really notable about them though they appear to enhance the existing crosswalks.
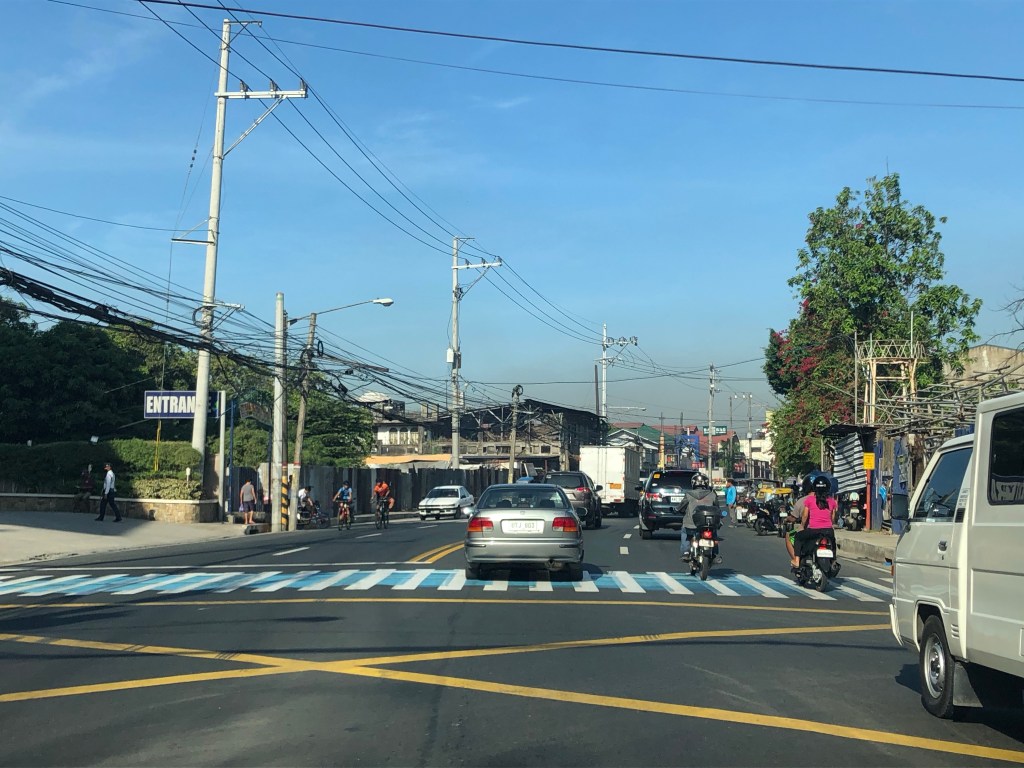
The artwork is practically invisible to motorists especially those on cars whose drivers’ eyes are lower than those driving SUVs, jeepneys, buses or trucks (i.e., larger and taller vehicles).
There is no strong evidence that such works enhance road safety.
There is no strong evidence that such works enhance road safety and you can check on this by doing either a quick or even an extensive search for literature proving significant impact. I guess the key here is to also install other devices such as a speed table or rumble strips for motorists to feel that they are approaching a pedestrian crossing. Also, perhaps instead of just painting on the crosswalks, they could have painted so as to widen the crosswalk. Then they could have increased the visibility for pedestrian crossings. That said, they should also have used the standard paints for these facilities that make them visible at night and could have been more resistant to weathering.
–
Why cycling or bicycles are good for the economy?
You saw that meme shared in social media where they say “why bicycles are bad for the economy”? There’s some humor there but it doesn’t necessarily convince many people to support cycling or biking over motor vehicle use.
Here goes one and note the logic:
“Cycling or bicycles are good for the economy because…it helps reduce car use/dependence. That means less dependence and expenses to fossil fuels. That means more money available to the household for more important stuff like food, homes and education.”
Can you come up with something like that?
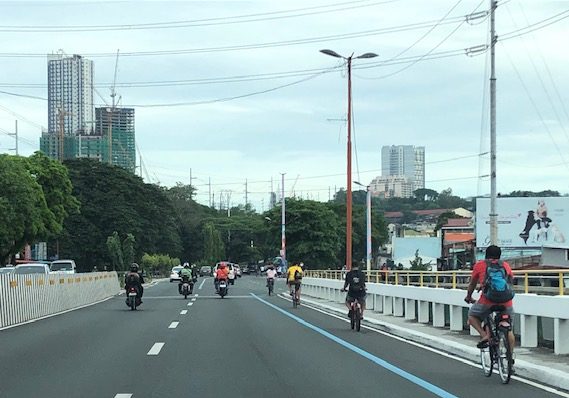 Workers on bicycles crossing the Marcos Highway bridge from Marikina towards Quezon City.
–
On people’s apprehension to use public transport
Public transport supply issues aside, there is also an apprehension to use public transport in the Philippines because of the perception that using public transportation will expose you to COVID-19 and lead to an infection. So far, this is far from the truth, which is that if proper precautions or countermeasures are applied (including physical distancing), public transportation can be safer than taking a car to move about.
Here is an article from the US co-written by Janette Sadik-Khan, who presided over the complete streets transformation in New York City. Aside from explaining how public transport can be safe, COVID-19-wise, the authors state that one must be most worried about conditions in places they go to including their workplaces, markets and yes, homes.
Sadik-Khan, J. and Solomonow, S. (2020) “Fear of Public Transit Got Ahead of the Evidence,” The Atlantic, https://www.theatlantic.com/ideas/archive/2020/06/fear-transit-bad-cities/612979/ [Last accessed: 6/25/2020].
Several groups have already called for jeepneys to resume services. Unfortunately, DOTr and LTFRB have other plans to implement; opting for a hard-push of the modernization and rationalization programs of the government. As such, despite the demand for public transport, the latter’s unavailability meant that many commuters had to take private vehicles to go to their workplaces. That meant those who usually could leave their cars home or at least opt for public transport most days reverted to their vehicles (note: the number coding scheme is still suspended for Metro Manila). Tricycles could only carry one passenger each; effectively making them 3-wheeler taxis. While train and bus operations have resumed, both have limited passenger capacities due to the physical distancing requirements.
Again, there are precautions and countermeasures that can be applied in order to ensure the reduction or minimization of infection risks. Public transport providers need to follow these guideline to prevent infections that can be attributed to public transport use, and help people trust in using these modes over cars.
–
On people’s reactions to the pandemic – more cars?
There is this article that argues that one result of the pandemic and the scare that it caused to a many is that people have resorted to car use during and after the lockdowns:
Vanderbilt, T. (2020) “People Are Buying Cars Because of the Pandemic. Cities May Change as a Result,“ Medium, https://gen.medium.com/people-are-buying-cars-because-of-the-pandemic-cities-may-change-as-a-result-e0657584f45e [Last accessed: 6/20/2020]
It was amusing for me to read the reference to cars as a sort of PPE but it comes as no surprise. It is psychologically like a suit of armor to some people and I guess this affects them the same way as some people’s personalities change when behind the wheel.
Whether this is true for the Philippines’ case we are now seeing somewhat but I say ‘somewhat’ because of the deficiencies in public transportation especially in Metro Manila. Government agencies in-charge of transportation seem to have found the perfect situation to roll out and push for both route rationalization and modernization. Major public transport routes have resumed operations but with buses instead of jeepneys. And slowly but somehow surely the “modern jeepneys” are being allowed but following the terms and conditions of the DOTr and the LTFRB.
–
On the importance of public transportation post-pandemic
I am sharing another article from Todd Litman that appear yesterday:
Litman, T. (2020) “Lessons from Pandemics: Valuing Public Transportation,” Planetizen, https://www.planetizen.com/blogs/109584-lessons-pandemics-valuing-public-transportation?fbclid=IwAR2jduFuYoyf_MoksI2Th4UoWtQYMQVOdwHuiih8JM9NxMN5pT_e1lwhgDQ [Last accessed: 6/13/2020]
The article contains material derived from previous work by the author and provides a list (and links to) resources or references related to this topic.
–
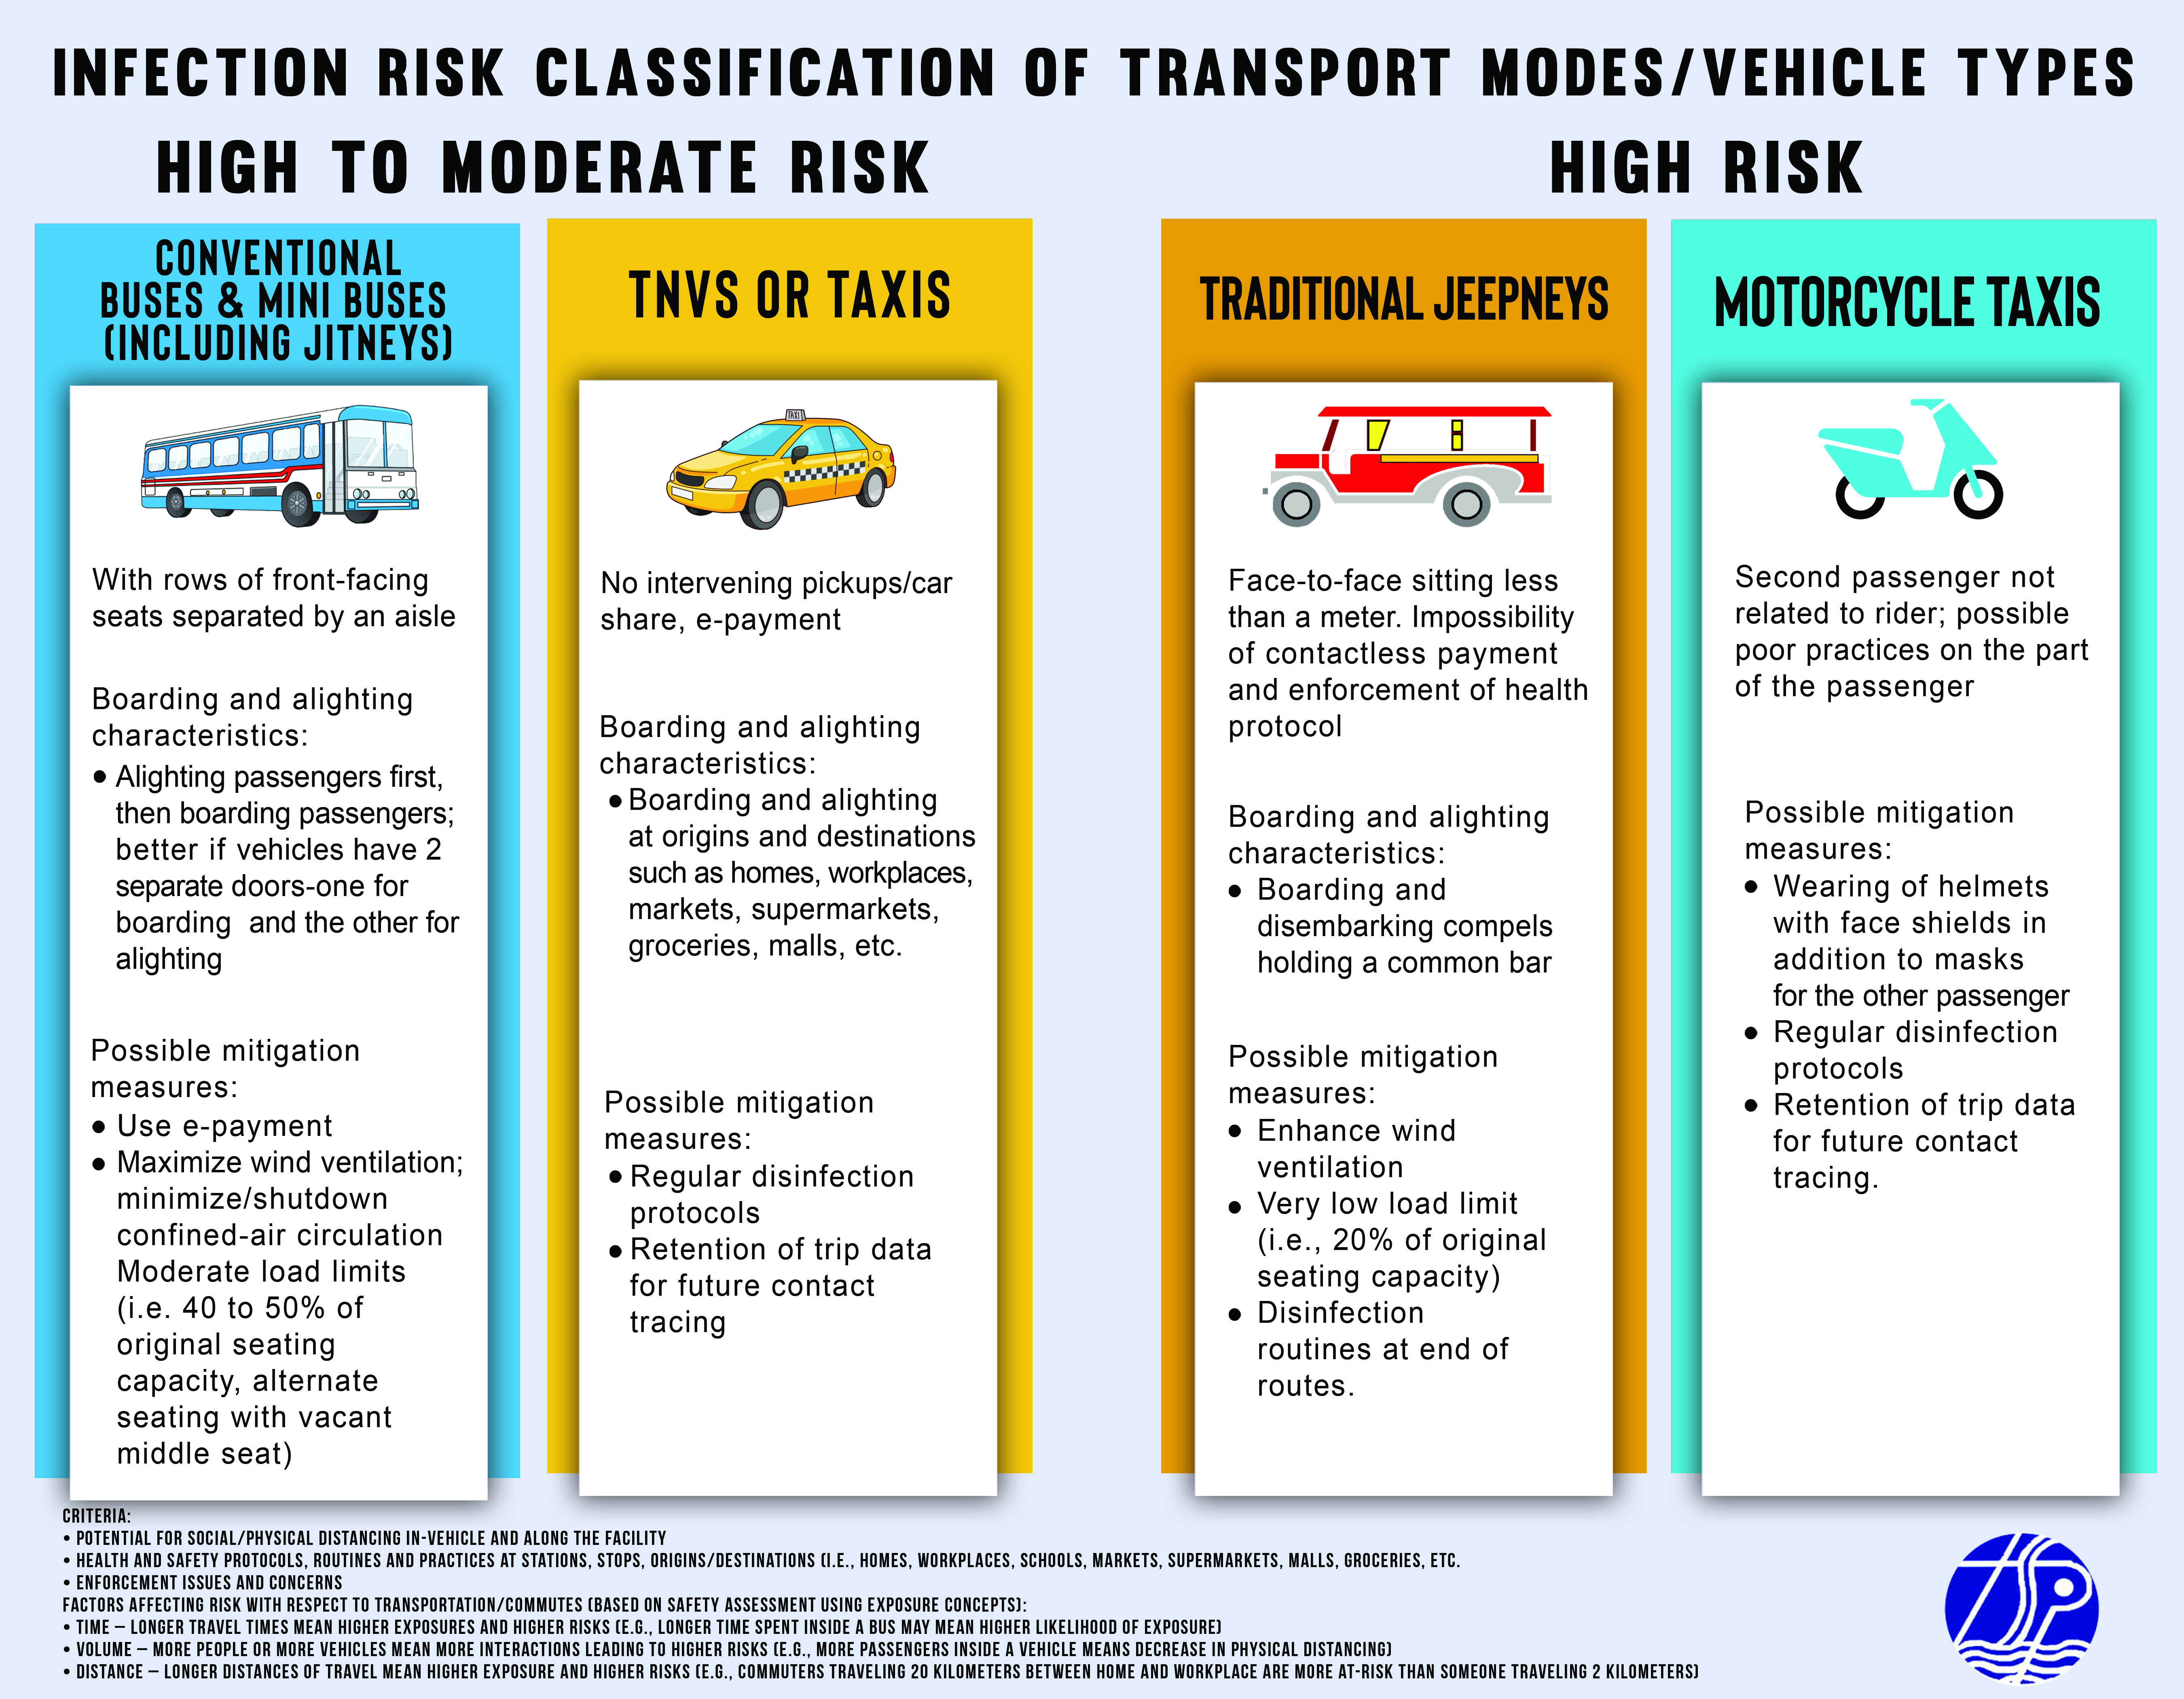
Infographics: Infection Risk Classification of Transport Modes Post-ECQ
The infection risk table I posted a few days ago was improved into the following infographics:


–
COVID-19 Infection Risk Assessment of Transport Modes
I posted about the work we have been doing to assess the infection risk (i.e., spread of COVID-19) for various modes of transport considering the transition of many areas including the National Capital Region (NCR) to the General Community Quarantine (GCQ). The work was undertaken through the Transportation Science Society of the Philippines (TSSP), which is under the umbrella of the Eastern Asia Society for Transportation Studies (EASTS). Here is the outcome in the form of an “Infection Risk Classification of Transport Modes or Vehicle Types” developed by a core group of public transportation and road safety specialists among its members:
![]()
![]()
![]()
![]()
Note again that this is the product of a rapid assessment using the mentioned criteria and factors. It is a qualitative assessment and a quantitative one, given the data, would obviously been preferred. Moreover, this is an assessment for risk of infection rather than for road safety. In the “old normal”, for example, cycling and motorcycle use may have a higher risk in traffic given traffic mix, human behavior and lack of facilities to make these modes safe.
–
Assessing the risk of infection from the transport safety perspective
My colleagues and I have been developing a risk assessment table for land transport modes to be submitted to the UP COVID-19 Response Team. We did a rapid assessment using mainly concepts from road safety.
The concepts are fairly simple. Risk assessment can be based on the likelihood of contracting the virus gauged from certain exposure factors. Exposure estimation may be quantitative where metrics are applied and data collected for the analysis. Estimation may alternatively qualitative based on experiences, perceptions, expert opinions, etc. but subject to logic (e.g., careful deduction). In road safety, for example, these factors may be defined as three: time, distance and volume.
Time exposure can be determined using travel time as a metric. Longer the travel times mean higher exposures for a commuter. Higher exposure translate to a higher likelihood that a person may become involved in a road crash. Thus, a commuter traveling for 1 hour, one way, will have a higher likelihood of being involved in a crash compared to another traveling only 10 minutes even assuming that both use the same mode of transport. Applied to the risk of viral infection, longer commutes may mean people can have higher exposure to potential carriers of the virus.
Distance exposure can be determined using travel distance as a metric. Longer travel distances mean higher exposures for a commuter. Higher exposure again translate to a higher likelihood that a person may become involved in a road crash. Thus, a commuter with a travel distance of 10 kilometers will have a higher likelihood of being involved in a crash compared to someone traveling only 1 kilometer. Applying this to the risk of viral infection is similar to the previous case for time exposure even when assuming the same mode of transport.
Volume exposure can be determined using both the volume of vehicles as well as the number of passengers inside the vehicles. The more vehicles or people you have on the roads interacting, the higher the likelihood of one becoming involved in a crash. It can also be argued that riding public transport in high volume, mixed traffic makes a passenger have a higher likelihood of being involved in a crash. Again, applying this to the risk of viral infection, it should be easy to understand why physical distancing is necessary in vehicles as well as outdoors when walking or cycling. It should also extend to having less vehicles on the road to further reduce the likelihood of spreading the virus.
In the real world, we cannot isolate each factor from one another. Instead, we have to contend with all three combining to create various scenarios. Along expressways, for example, the volume of vehicles might be high and so are distances. Time exposure can be lower due to high speeds. Yet high speeds can contribute to increased likelihood of crashes. Meanwhile, traffic congestion has all the ingredients for maximizing the likelihood for crashes and, by extension, viral infection. Long commutes (by time and distance) plus high volumes of people and vehicles combine to create the worst case scenario from the perspectives of both road safety and infection, which are both public health issues.
Next – Why we should not return to the old normal…
–
On urban planning resources or references for the pandemic
I am posting for reference this article compiling helpful references for urban planning in the context of the COVID-19 pandemic. Most of the references listed are based on the US experience and I am sure there is already a wealth of information coming from other countries as well including those that have been successful in mitigating the effects of the pandemic.
Brasuell, J. (2020) “Urban Planning Resources for COVID-19”, Planetizen, https://www.planetizen.com/node/109238?utm_source=newswire&utm_medium=email&utm_campaign=news-05142020&mc_cid=2e155996b6&mc_eid=9ccfe464b1 [Last accessed: 5/16/2020]
–
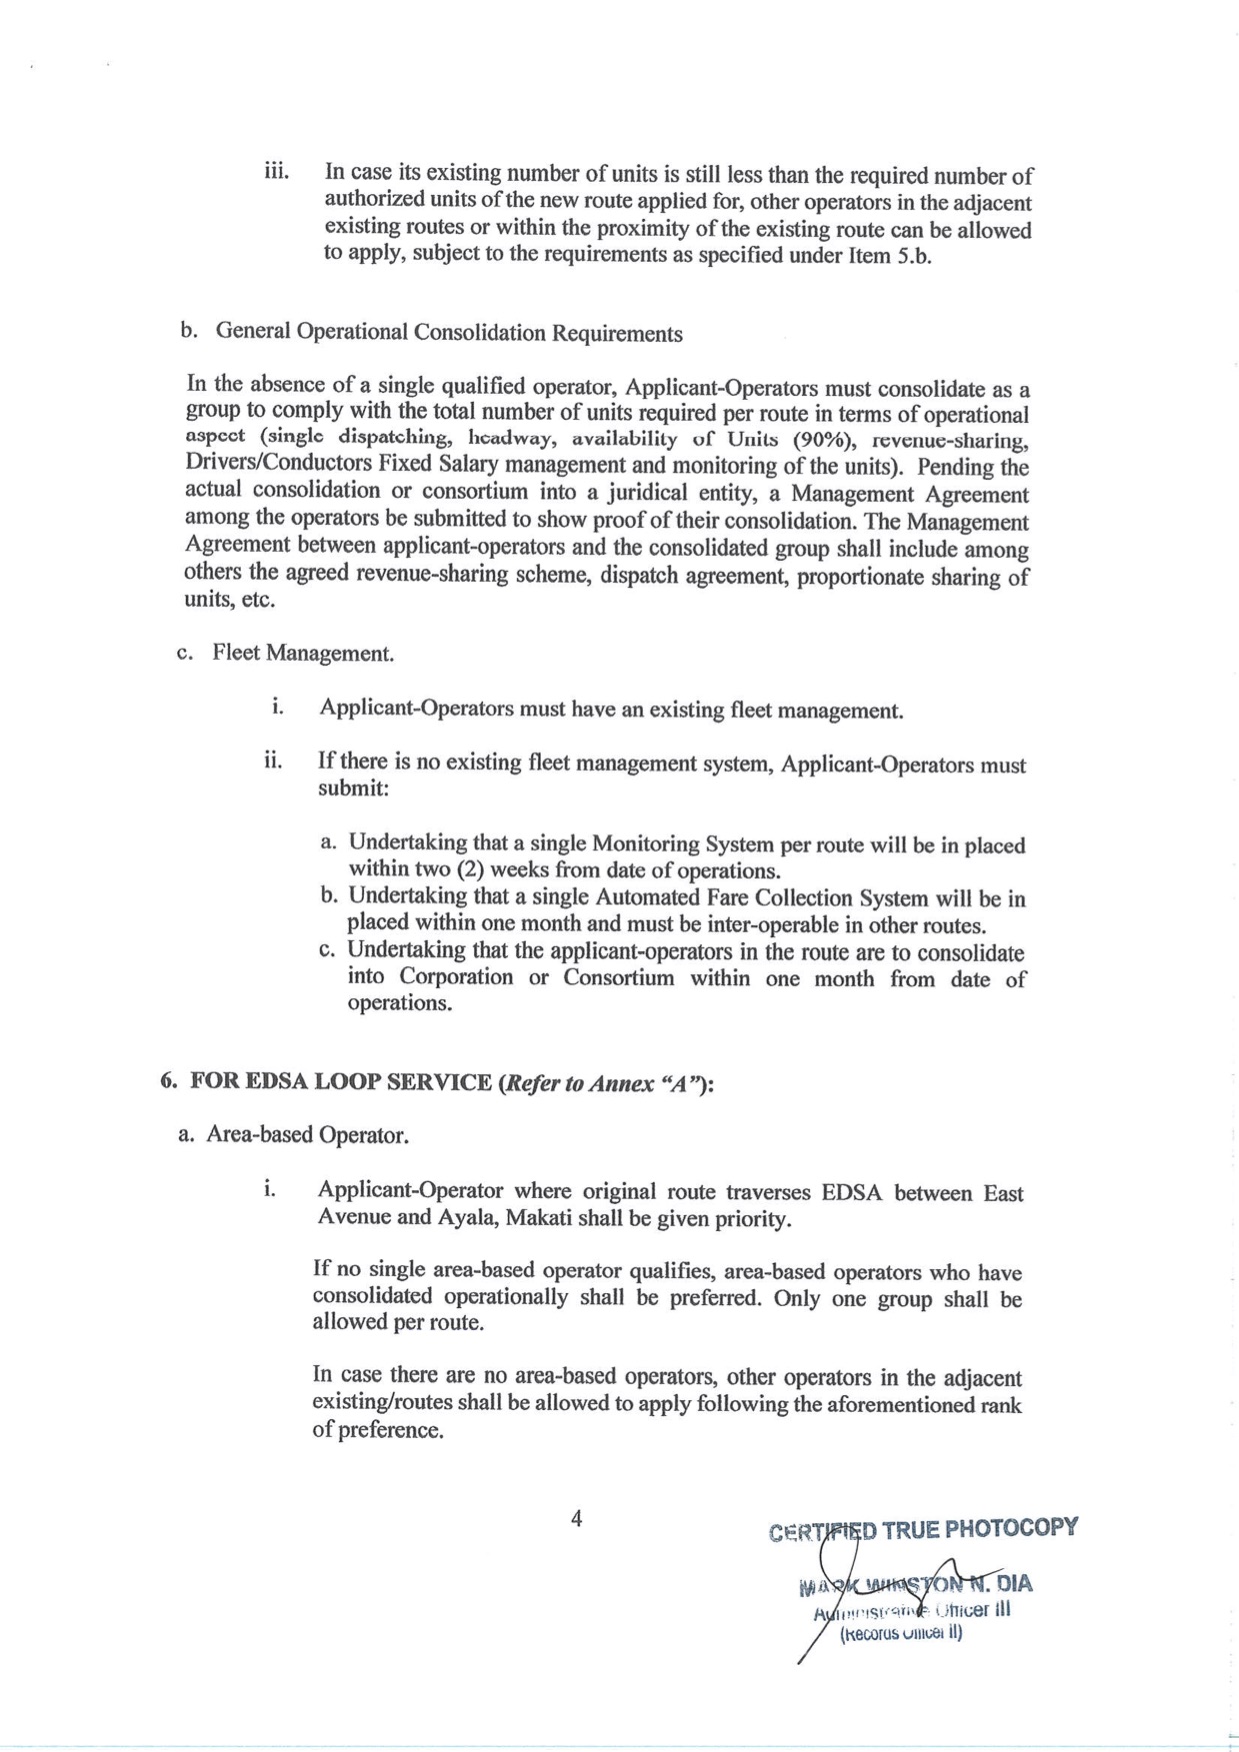
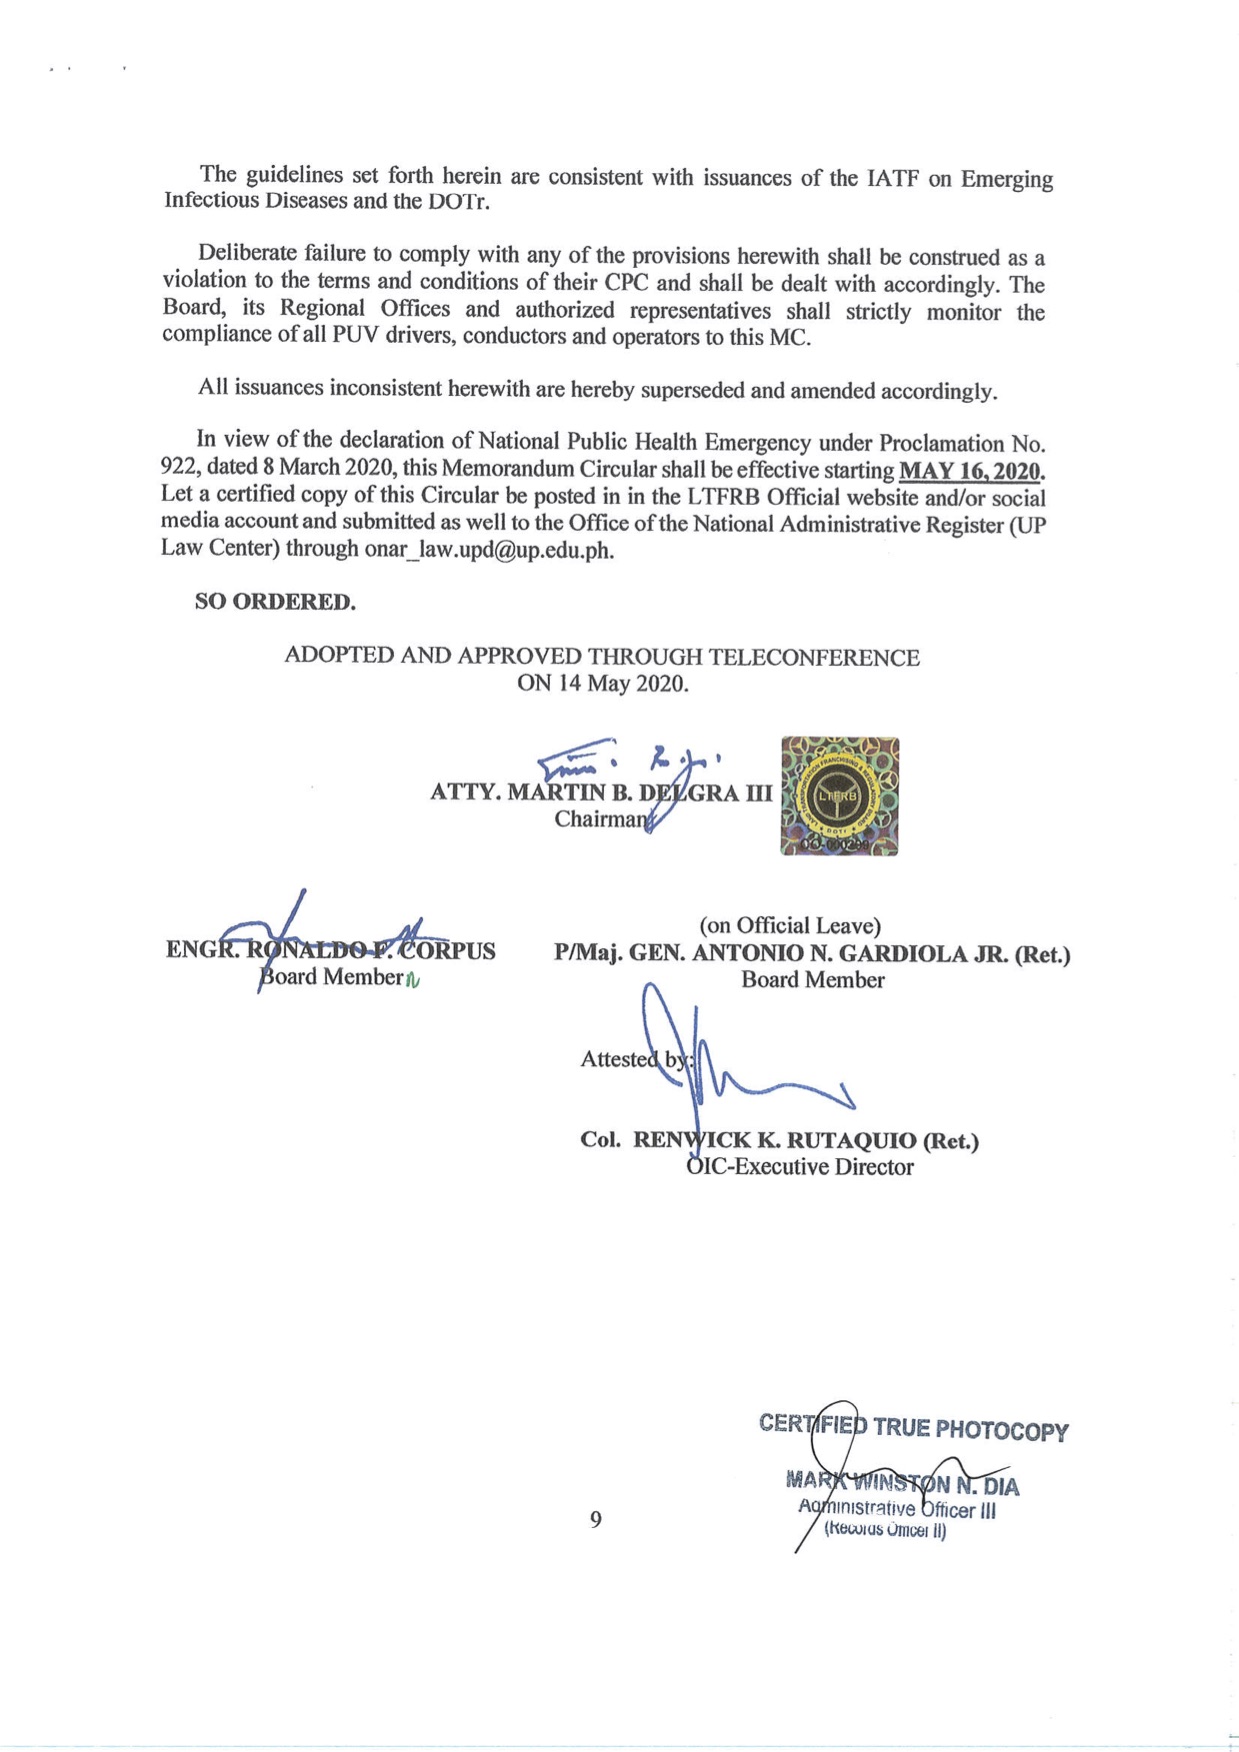
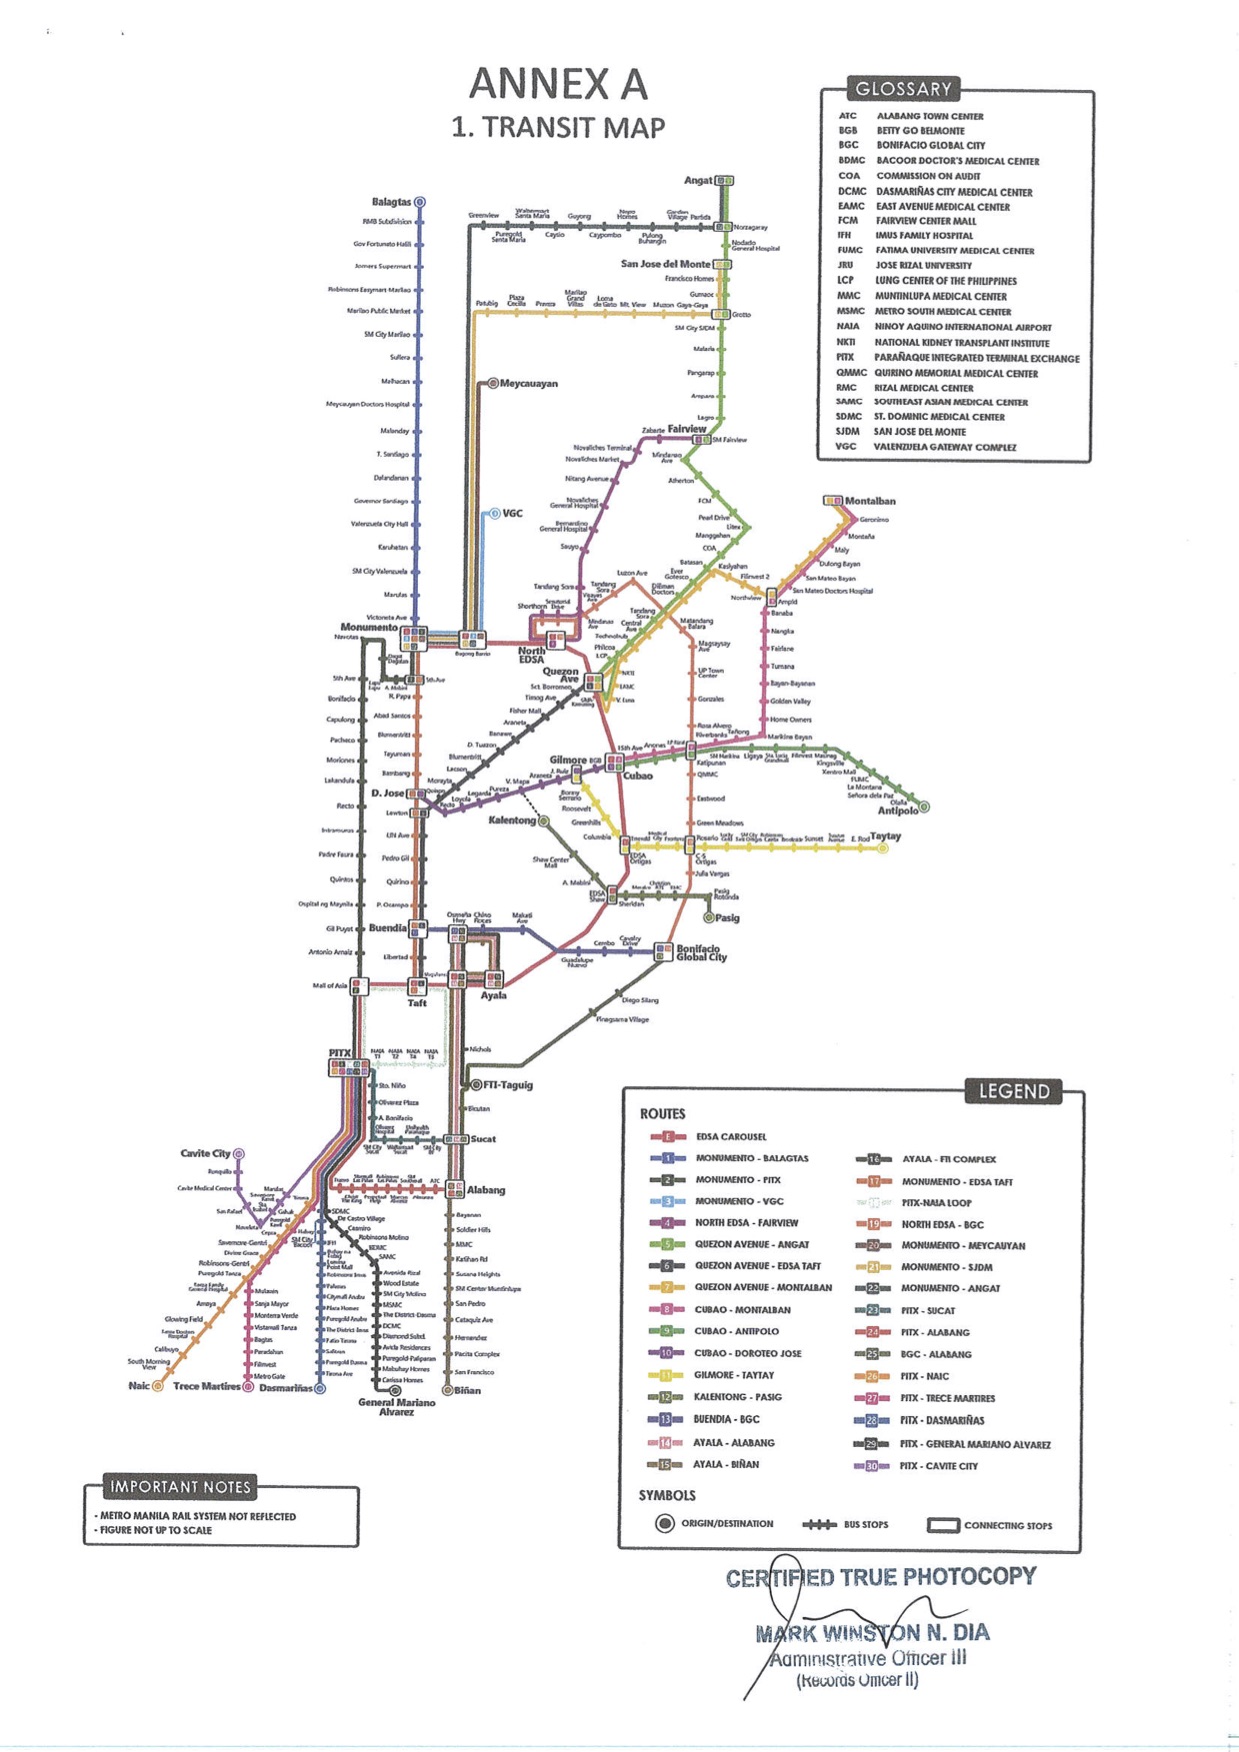
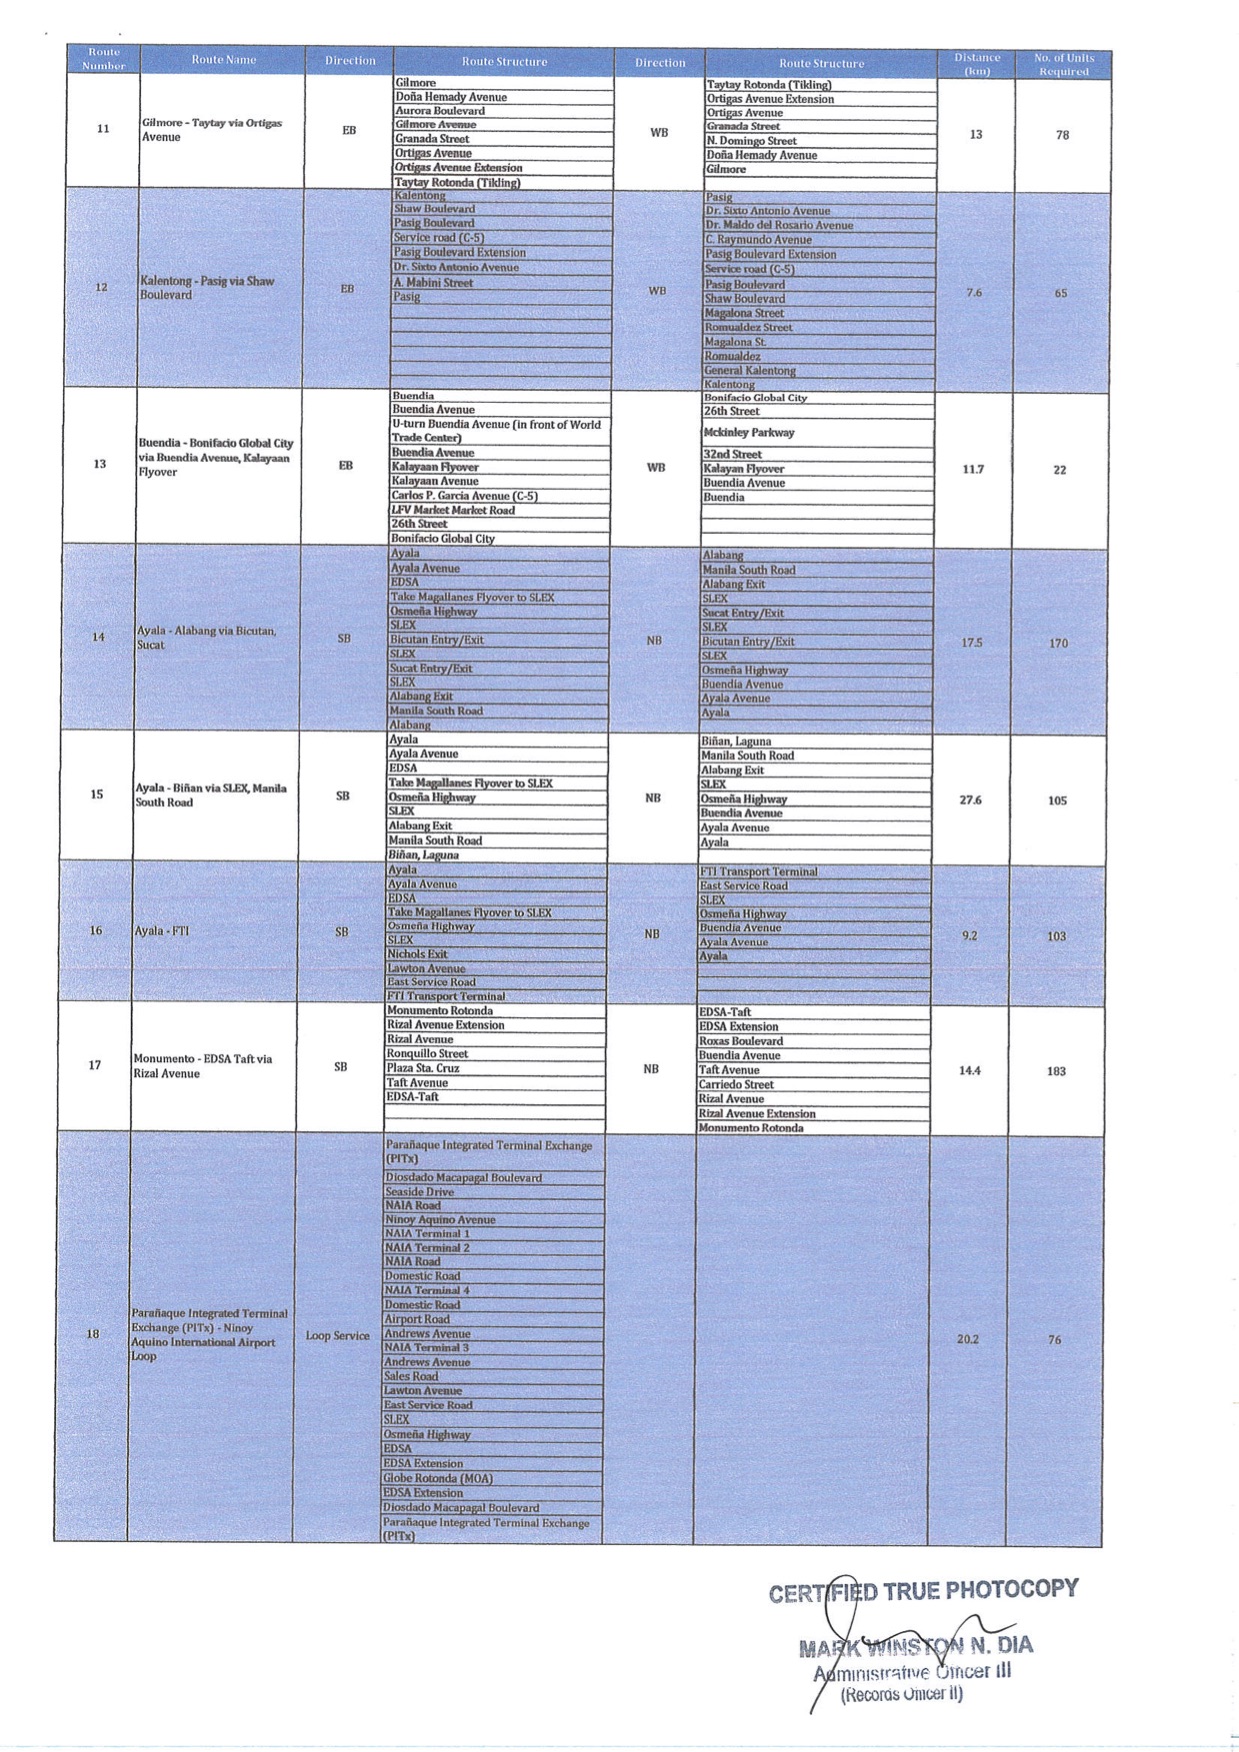
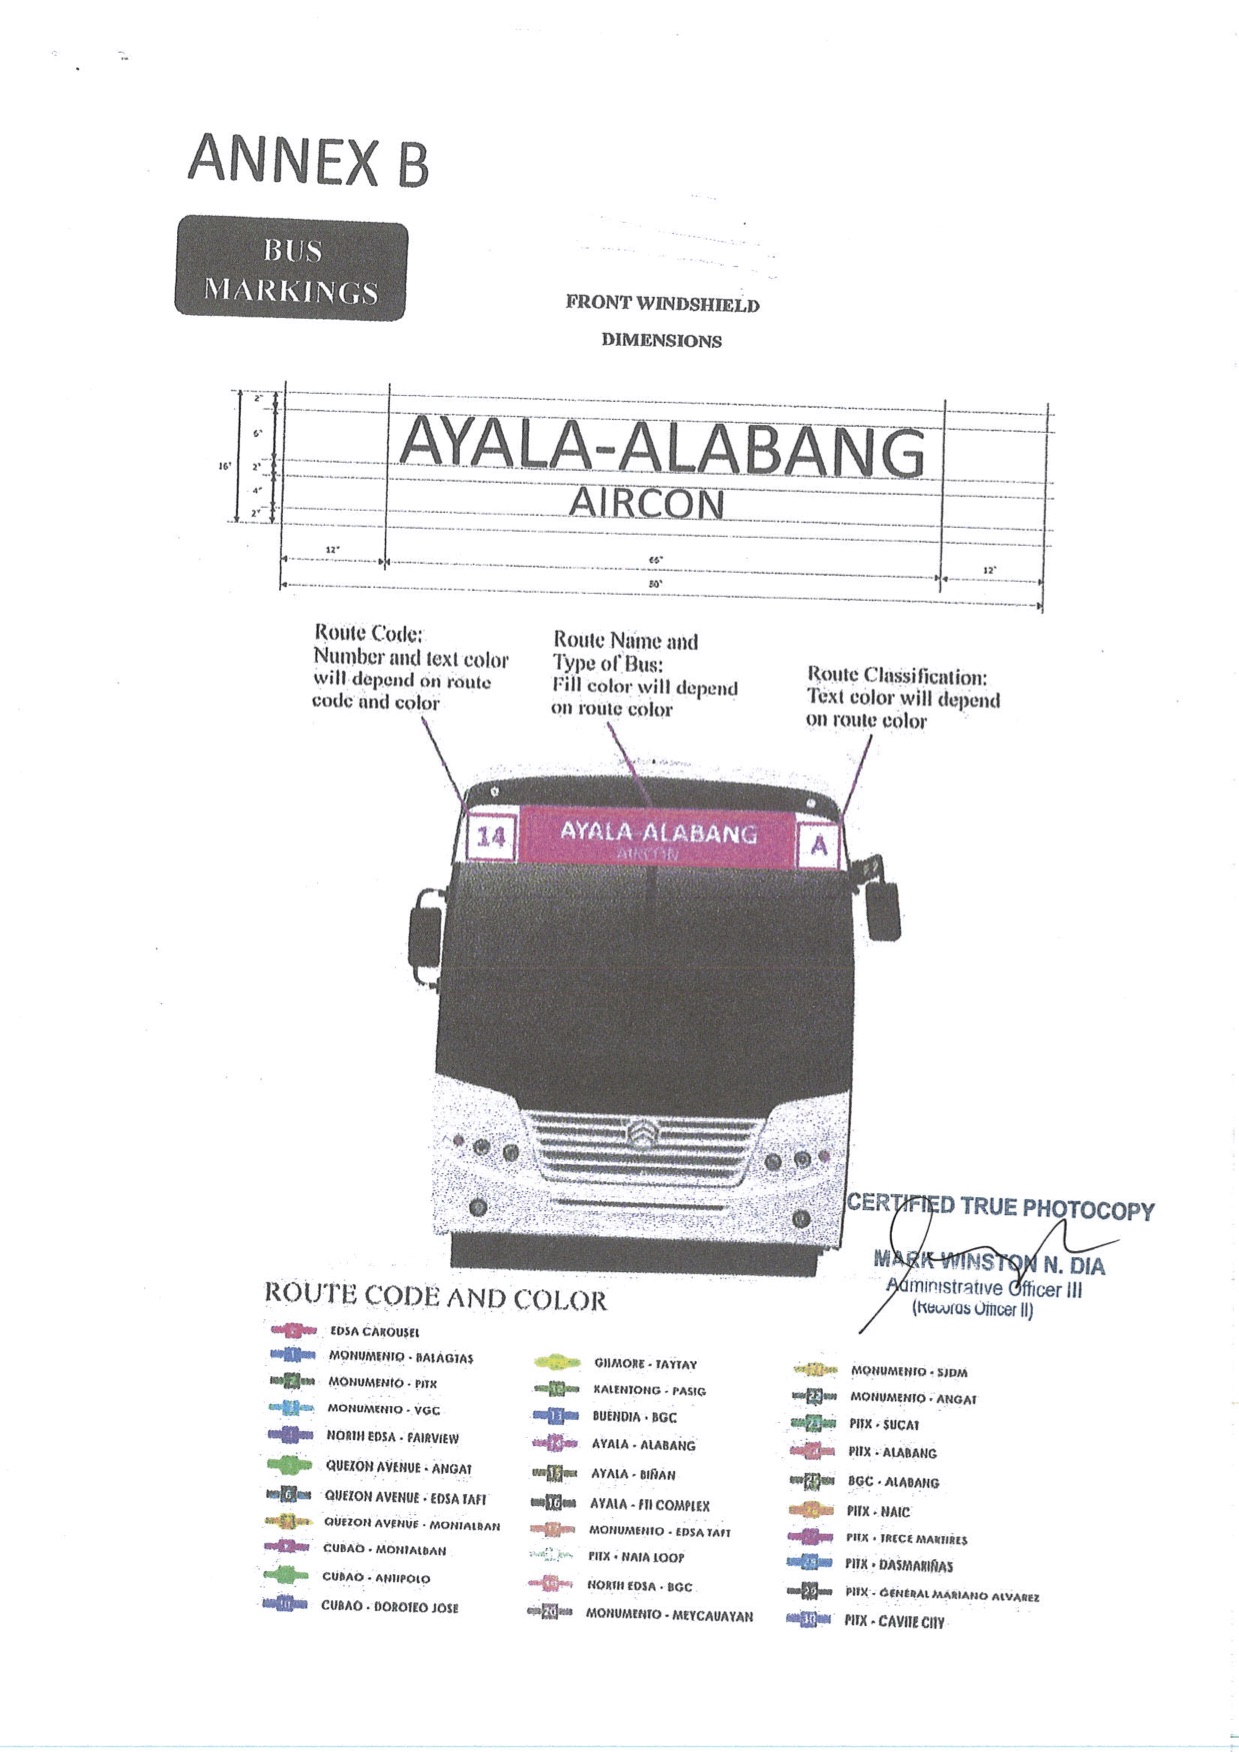
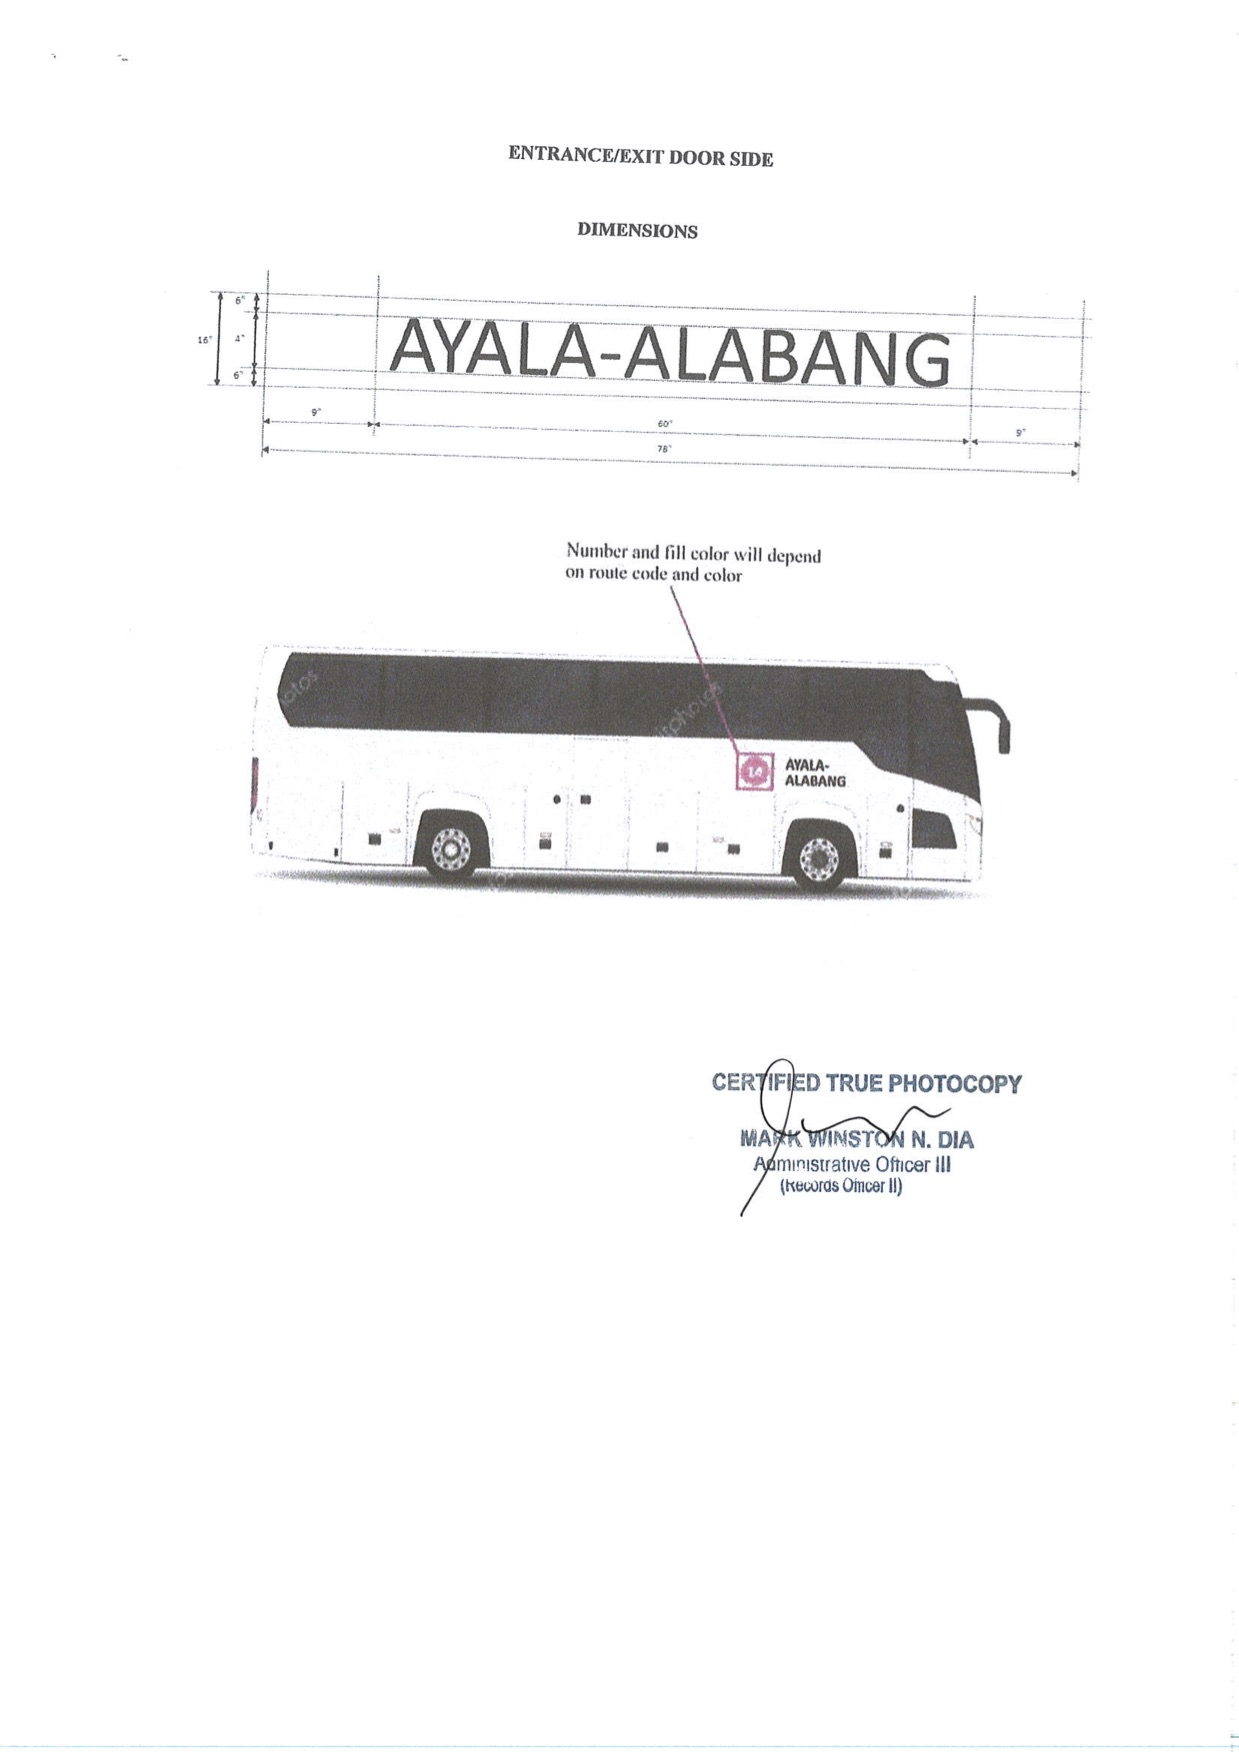
LTFRB Memorandum Circular No. 2020-019 – Guidelines for the Operations of PUBs During the Period of GCQ in Metro Manila
The following images show the full 19 pages of the Land Transportation Franchising and Regulatory Board Memorandum Circular No. 2020-019: Guidelines for the Operations of PUBs During the Period of GCQ in Metro Manila. Again, no comments for now as I post this for reference. I have not seen it posted on the LTFRB’s Facebook page yet but it is a public document and something that needs to be circulated for the benefit of the riding public.


–
