Home » Behavior » Infographics: Infection Risk Classification of Transport Modes Post-ECQ
Archives
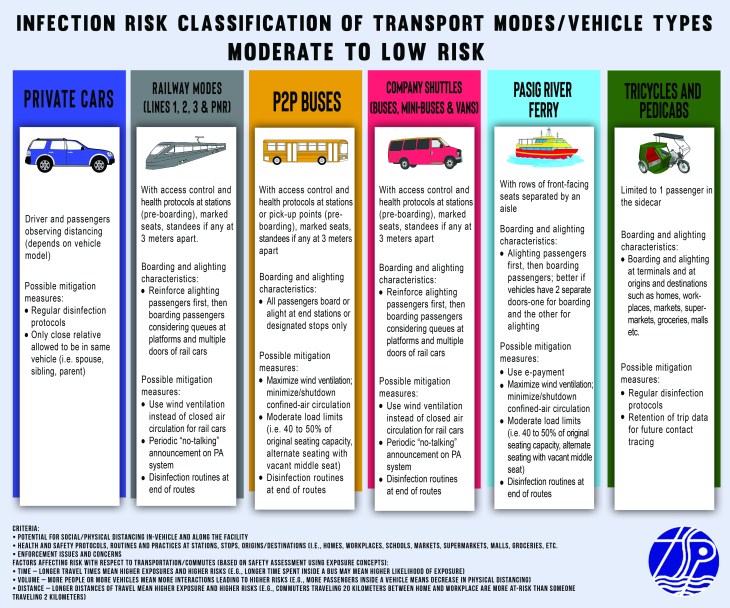
The infection risk table I posted a few days ago was improved into the following infographics:


–
Tags: policy, public health, public interest, public transportation, safety
By d0ctrine in
Behavior, EST, Health, Mode Share, Motorcycles, NMT, Pedestrian, Policy, Public Transport, Railways, Transport Planning on
.

