
Home » Posts tagged 'bicycles'
Tag Archives: bicycles
On whether bike lanes cause more traffic congestion
I previously share articles on whether bike lanes cause more traffic. This question has been asked so often as we have returned to the “old normal” levels of traffic and bike lanes that were put up during the pandemic have been neglected or removed in favor of motor vehicle traffic. The perception for those in-charge of traffic and transportation in local government units is that the space occupied by bike lanes take up the space demanded by motor vehicle use. Thus, the view that bike lanes cause congestion. Here is another article share in support of bike lanes:
Mortillaro, N. (October, 2024) “Do bike lanes really cause more traffic congestion? Here’s what the research says,” cbc.ca, https://www.cbc.ca/news/science/bike-lanes-impacts-1.7358319 [Last accessed: 01/11/2024]
To quote from the article:
“One would think that building more roads with more lanes for cars would reduce congestion, but research shows that’s not the case, thanks to something called induced demand. The more traffic lanes that are put in, the more it appeals to people who may not otherwise have chosen to drive, thereby putting more cars on the roads and increasing congestion.
“So for a short period of time, there might be a slightly improved [reduction], but within a year or two, or perhaps three, traffic is as bad or worse than it was before the lanes were added in the first place,” said David Beitel, data services lead at Eco-Counter, a Montreal company that collects and analyzes pedestrian and bicycle traffic data.
Conversely, if you put in more dedicated bike lanes, people tend to feel safer and demand for use increases, said Shoshanna Saxe, an associate professor at the University of Toronto’s department of civil and mineral engineering and Canada Research Chair in sustainable infrastructure.
“As soon as you build a bike lane, within a year, two years, the latent demand shows up,” she said.
Bike Share Toronto statistics show that ridership on its network of shared bikes has increased dramatically since 2015, when 665,000 bike trips were made annually. In 2023, that shot up to 5.7 million trips.”
I think many people here are already aware of the concept of induced demand. However, this is usually shrugged aside as realities in their situations (e.g., commuting options, locations of residences and workplaces, etc.) lead them to choosing private vehicles (i.e., cars and motorcycles) over public or active transport. The last paragraph there is significant though as there never was and so far a decent estimate of bike trips in any city in the Philippines. Granted that there are attempts to measure bike trips but the volumes published so far are not as reliable as we want them to be in order to be convincing decision-makers to put up more bike lanes. Of course, the convincing part is always challenging if decision-makers have already made up their minds in favor of the car.
–
Technical sessions at the TSSP 2024 Conference
I am sharing here the latest draft of the technical sessions for the 30th Annual Conference of the Transportation Science Society of the Philippines (TSSP). The conference will be held in Iloilo City this coming September 13, 2024.
I will share the draft program for the morning plenary session in the next post.
–
SPRINT principles for bicycles
Here is the link to how to improve your city’s or municipality’s bicycle facilities based on scores guided by the SPRINT principles: https://cityratings.peopleforbikes.org/create-great-places
SPRINT stands for:
S -Safe Speeds
P-Protected Bike Lanes
R-Reallocated Space
I-Intersection Treatments
N-Network Connections
T-Trusted Data
The site provides links and examples of good practices of actual bike projects in the US. Many of these can be replicated or adapted to Philippine conditions. These are something that the active transport section of the Department of Transportation (DOTr) should look into and perhaps provide a reference for developing and improving bicycle facilities in the country.
–
On walking and taking the stairs
With the increasing popularity of active transport, people still forget that biking is not the only mode being referred to by the term. Walking is the most basic form of transport for us and there are many creative ways to encourage walking even if it is indoors like in an office building, a school building or a shopping mall. Here is a photo of the stairs at one mall with encouraging words for those taking the stairs instead of the escalators or elevators. It only takes 30 minutes of walking everyday to gain the benefits of a more active lifestyle.

My daily walks take me up and down the hilly roads in our neighborhood. I attribute to these walks my relatively effortless climbs to the 4th floor of our school building where my office is. Our elevator has been out of commission for some time now so we are all forced to take the stairs to our lecture rooms and offices. These I refer to as ‘stairmaster’ exercises, which is included in my daily routine so it adds to my step count as well as being recorded for the flights of stairs I take each day. I attest to this routine to improving my health and well-being, and highly recommend this to those who are able to do so.
–
Bike lane master plan for Metro Manila, Metro Cebu and Metro Davao
The Department of Transportation (DOTr) with support from the United Nations Development Program (UNDP) yesterday formally launched the Bike Lane Master Plan for Metro Manila, Metro Cebu and Metro Davao. Yesterday’s event was actually the third and last leg of presentations, which were also made in Cebu and Davao. Here are a few photos I got from the DOTr Facebook page (these are public):
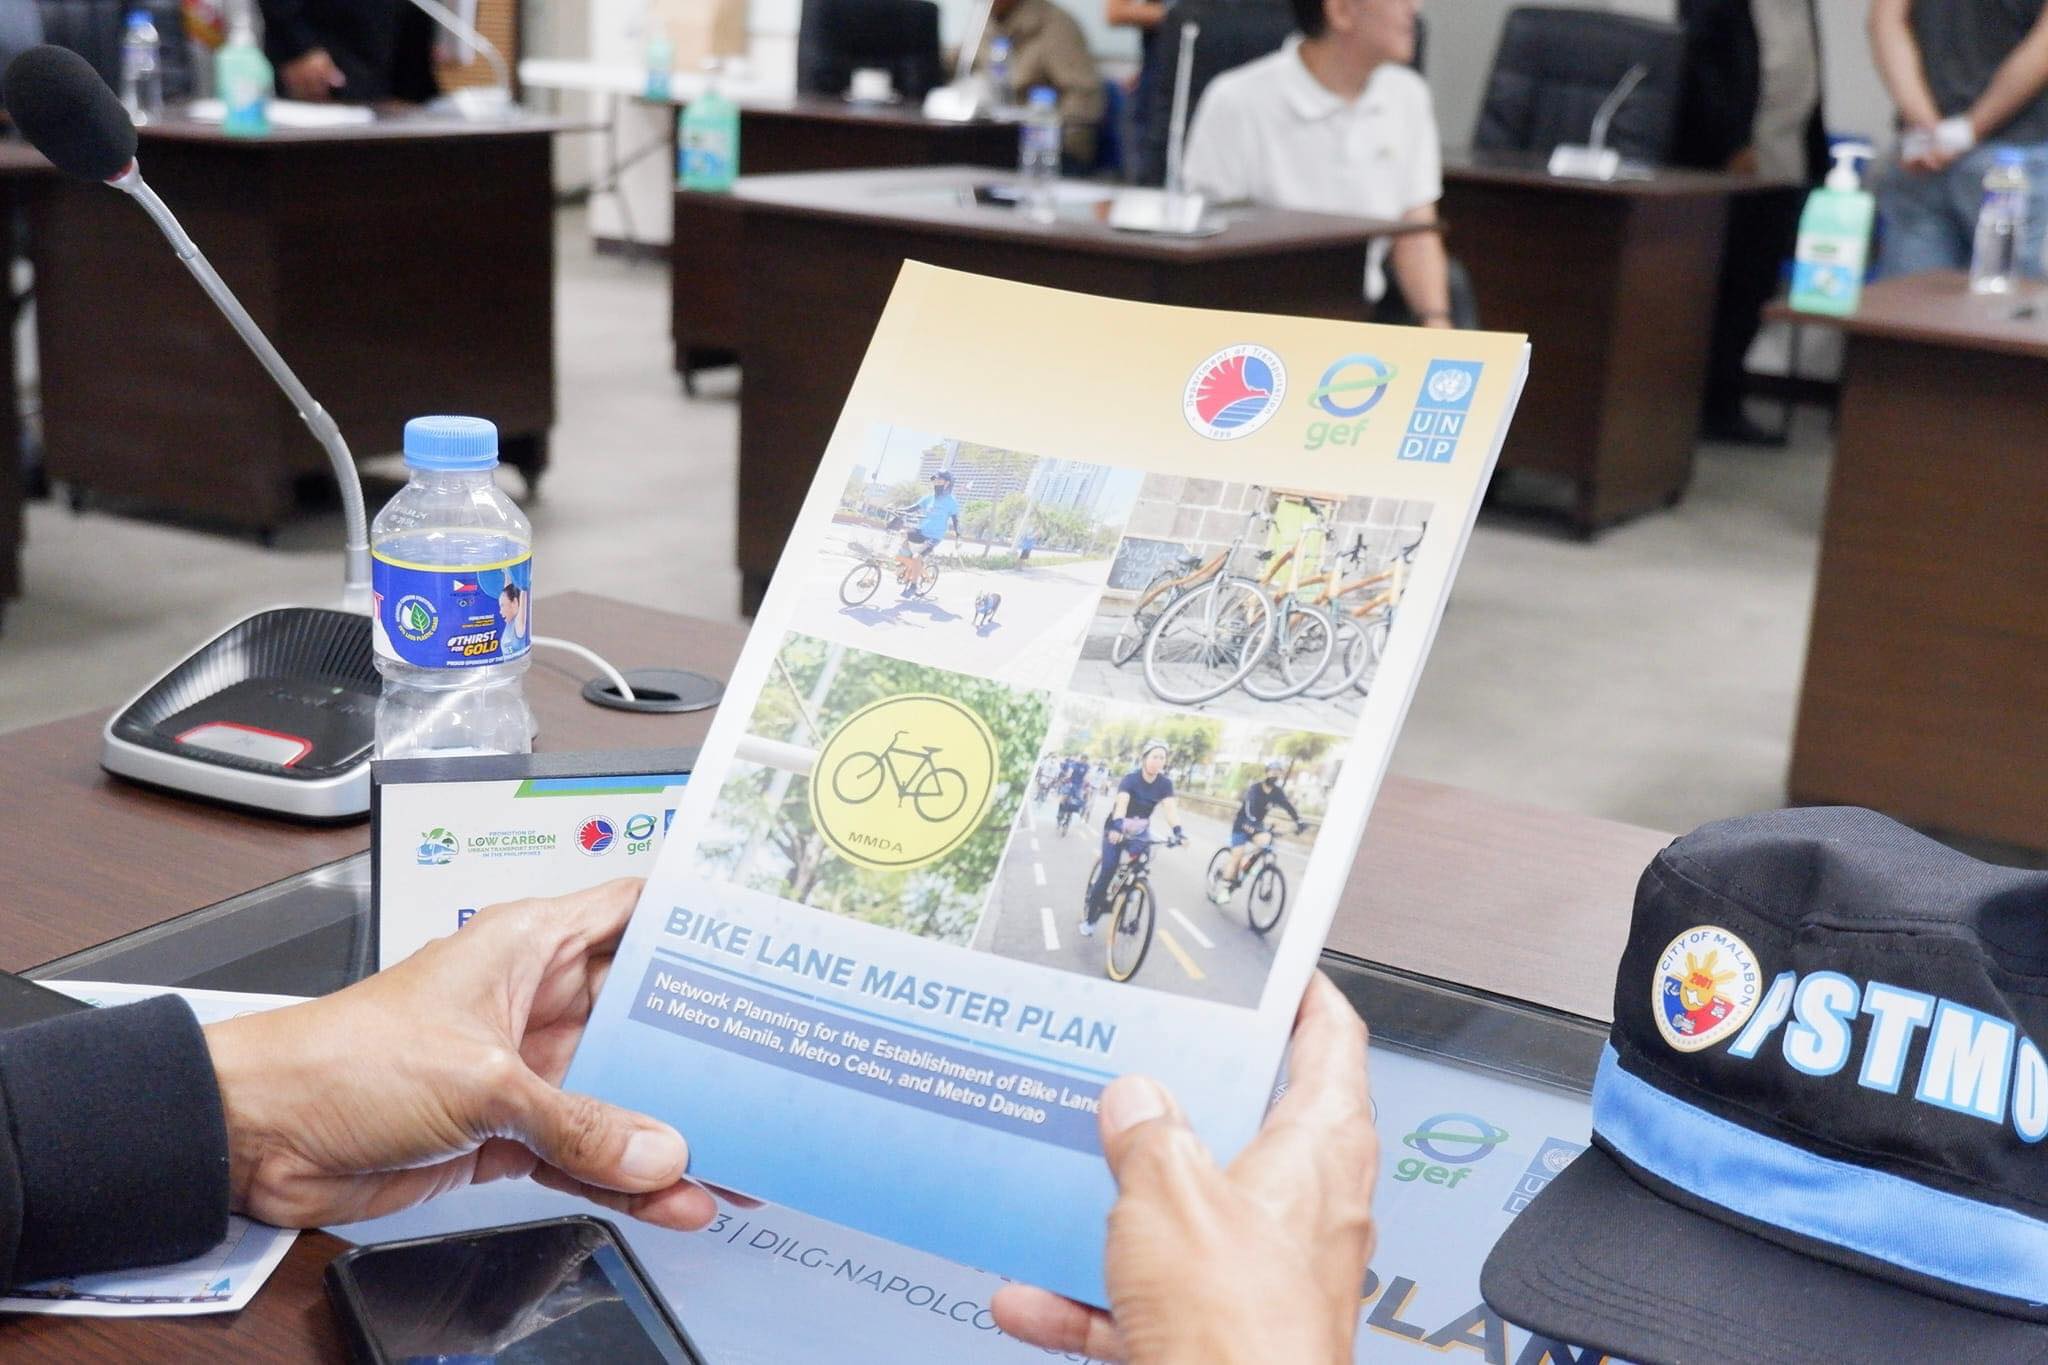 Printed copies of the master plan were distributed to attendees (Photo: DOTr Facebook page)
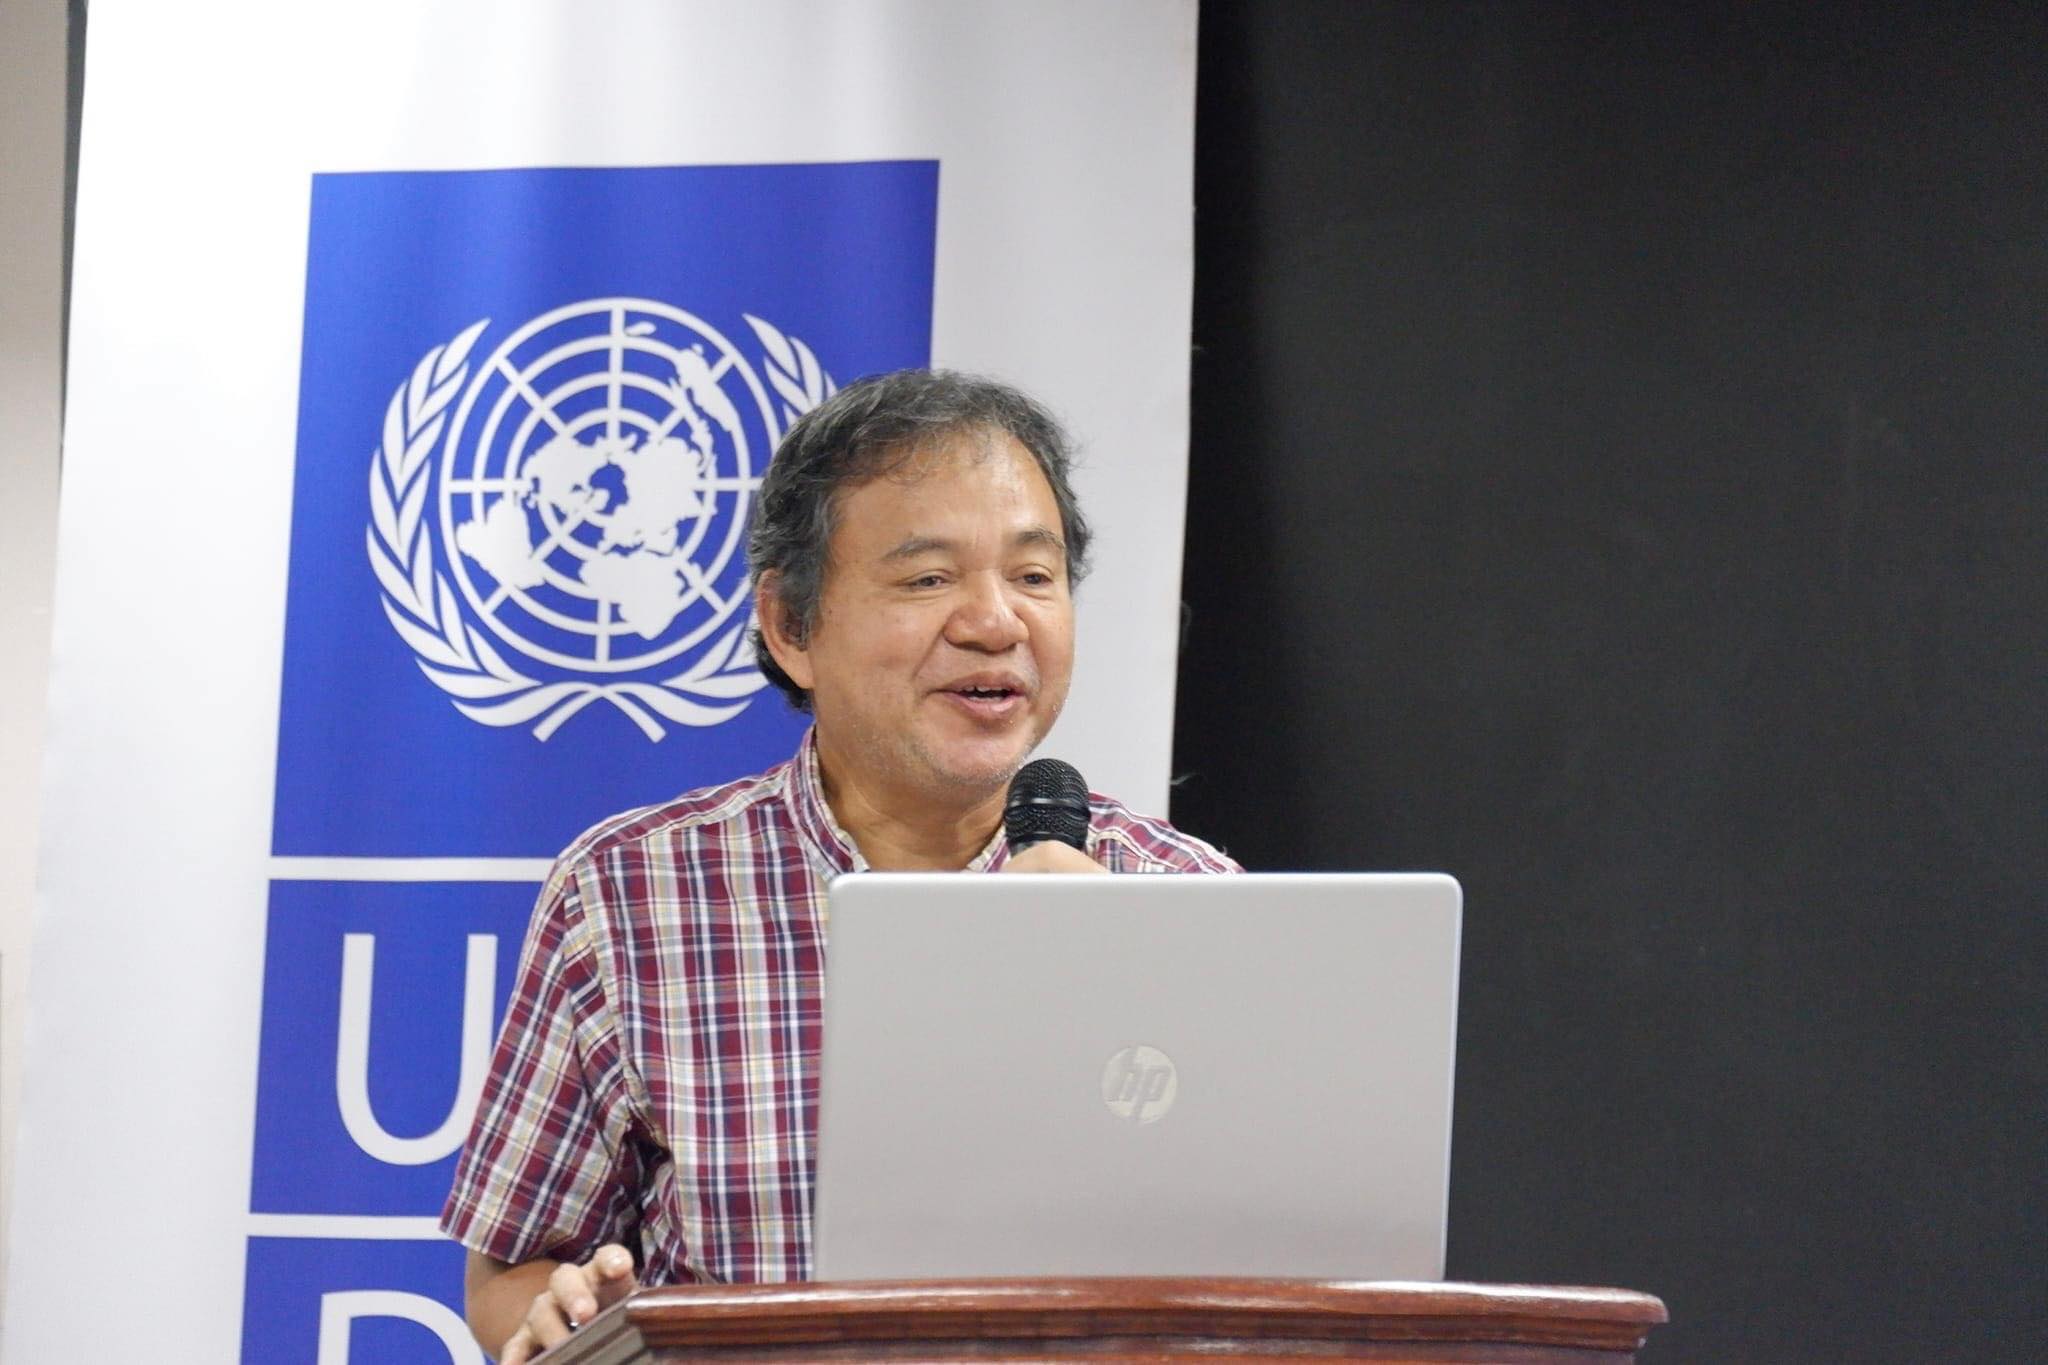 Dr. Ricardo Sigua of the National Center for Transportation Studies presented the highlights or key features of the master plan. The UNDP engaged NCTS to conduct the master planning project for DOTr. (Photo: DOTr Facebook page)
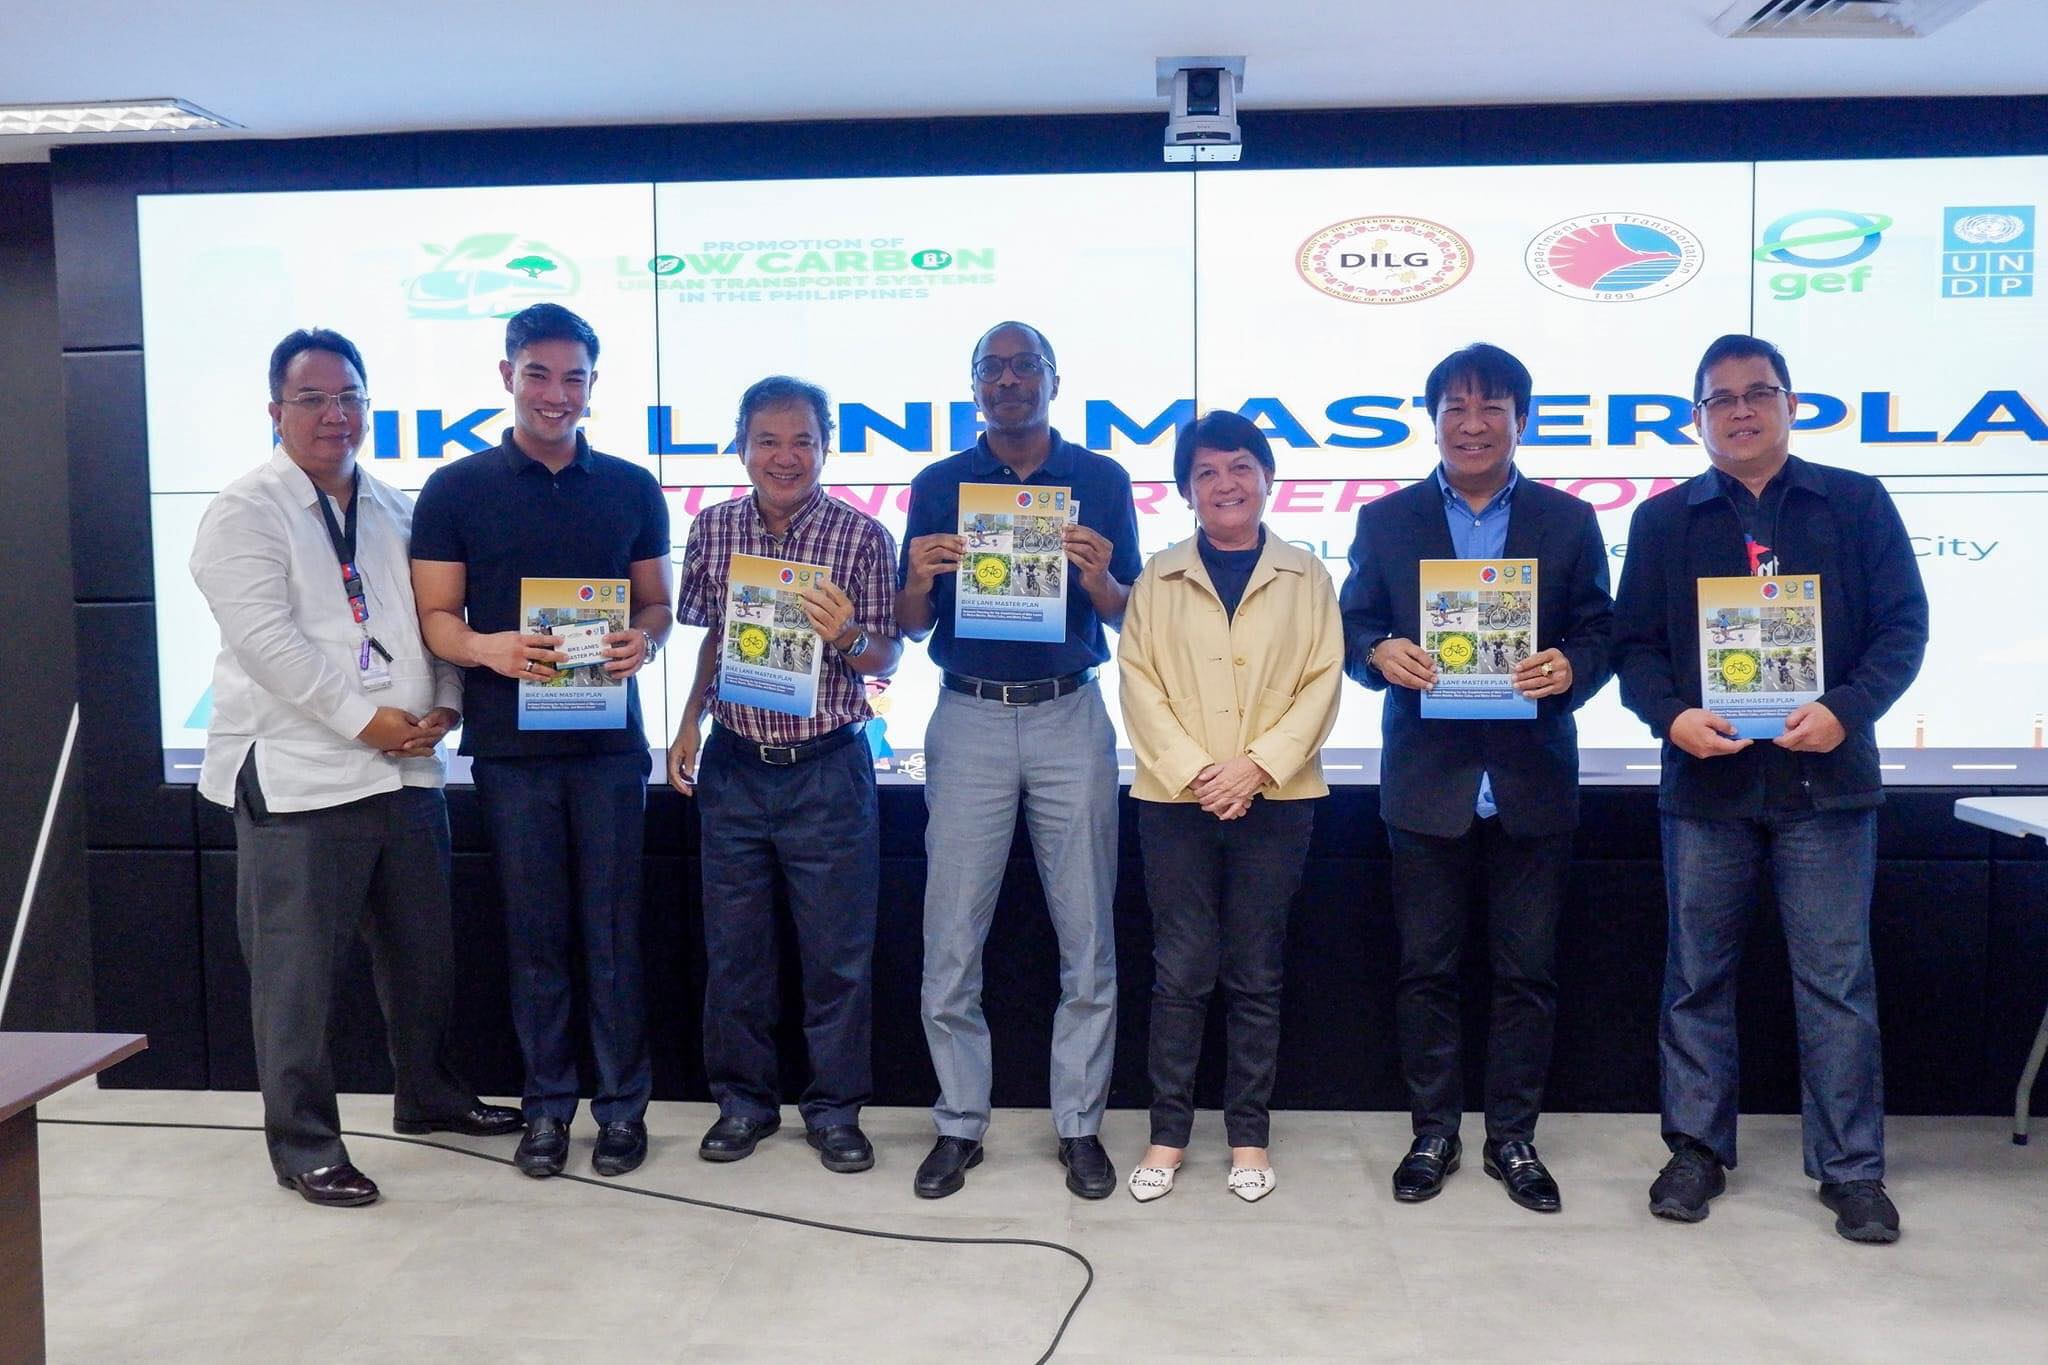 Photo op with participants from the MMDA (Photo: DOTr Facebook page)
While the master plan is most welcome as the country continues to build infrastructure for active transport (mainly walking and cycling), the launch is actually one year late. The project was actually completed last year and though most of the recommendations have yet to be carried out, many items including the inventories are already dated. These master plans though should not be static documents but dynamic in these sense that it would have to be updated regularly. For one, updates would provide the opportunity to reinforce or improve certain aspects of the plan. Updates also provide an opportunity to check whether progress is being made on the targets set in the plan. Also, since the master plan is for three metropolitan areas perhaps it can be part of the foundation for a nationwide plan. However, many plans fail if there is not support or scarce resources allocated for the implementation. Thus, there is a need for resources or allotments especially coming from government to support the realization of the plan.
–
On bicycles as a preferred mode of transport
Sharing this article on bicycles being the perfect mode of transportation. It is framed with respect to the concept of the 15-minute city. Here is the article:
Johnson, R. (April 19, 2023) “Embracing the 15-Minute City: 7 Reasons why Bicycles Are the Perfect Mode of Transportation,” Momentum Mag, https://momentummag.com/embracing-the-15-minute-city-7-reasons-why-bicycles-are-the-perfect-mode-of-transportation/ [Last accessed: 4/29/2023]
To quote from the article:
“Bicycles are aligned with the goals of sustainability and climate action, as they contribute to reducing greenhouse gas emissions, air pollution, and congestion. In a 15-Minute City, where the focus is on creating sustainable and climate-friendly communities, bicycles can be a powerful tool to achieve these objectives. By promoting cycling as a viable transportation option, cities can reduce their carbon footprint, mitigate climate change impacts, and promote a greener and healthier way of living.”
–
On bicycles and first responders
I am sharing this article on the use of bicycles by first responders, particularly the police for their work:
International Police Mountain Bike Association (April 11, 2023) “Why Bicycles are Great for Police and First Responders,” Policemag.com, https://www.policemag.com/patrol/news/15382905/why-bicycles-are-great-for-police-and-first-responders [Last accessed: 4/15/2023]
To quote from the article:
“The advantages of using bicycles in public safety include:
• Bicycles can easily penetrate crowds – in highly congested areas police, EMS, and security personnel on bikes can move around more easily than patrol cars and ambulances.
• Response time in heavy traffic is improved – during their trial period in Orlando, bike medics responded in less than one minute 55% of the time; less than two minutes 83% of the time; and less than three minutes 95% of the time; contrasted with an average of four minutes for motorized rescue units.
• Stealth advantage – bicycles give officers the “stealth advantage” – because they are silent. Cops on bikes can ride right up to the scene of a crime before they are noticed.
• Police, EMS, and security cyclists lead by example – promoting helmet use and bike safety to the community and its children.
• Bicycles are great for public relations – an officer or a medic on a bike is much more approachable than one in a patrol car or ambulance.
• Bicycle use promotes good health – and departments benefit from decreased healthcare costs.
• Bicycles are enjoyable – even occasional bike duty improves morale.
• Bicycles are cost-effective – the average cost per bike is approximately $1200, a fraction of the cost of a cruiser, an ambulance, or any other motorized vehicle – and the annual maintenance costs are low.
• Bicycles are environmentally-friendly – no fossil fuels or emissions, and less parking surface is needed.”
While there are no disadvantages mentioned in the article, the advantages are clear and can be assumed to outweigh the cons of using bicycles. This is especially true in an urban setting where the items mentioned above are applicable and surely gives police and other first responders an advantage. In the Philippines, where the image of a bad or corrupt police officer is one who has bulging tummy, more physically fit and approachable officers on bicycles will surely improve the image of the PNP and other traffic enforcers as well.
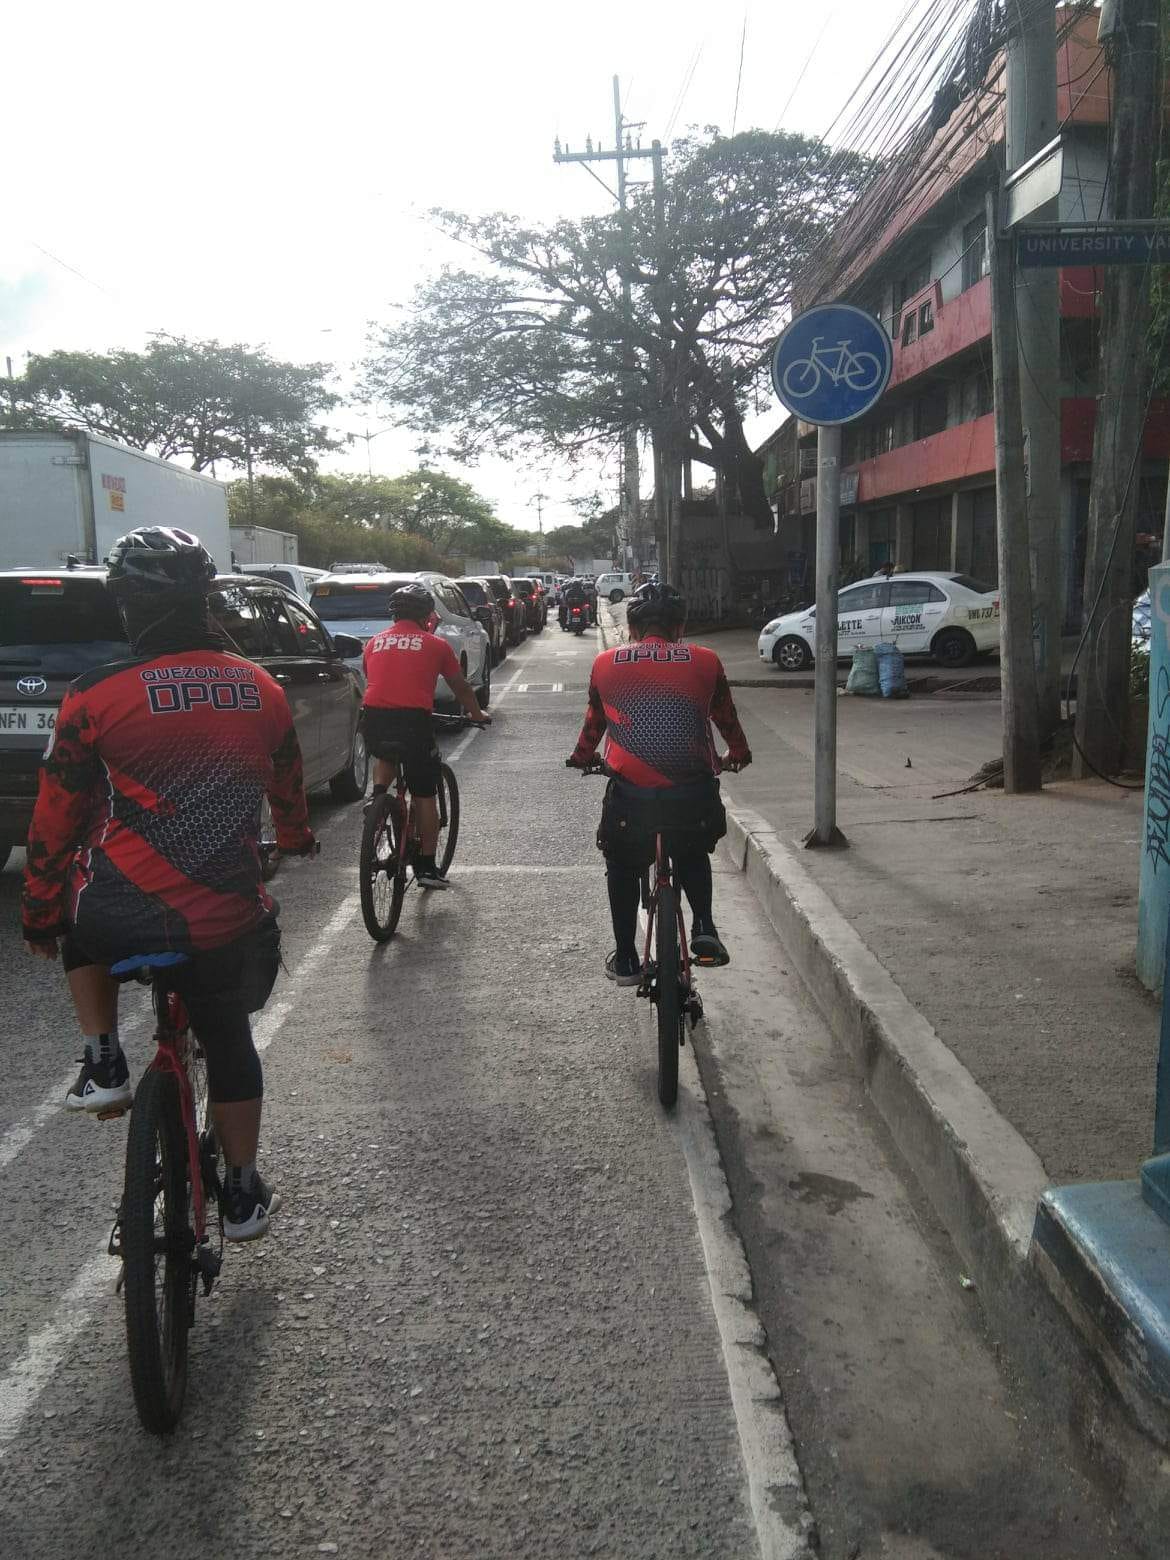 Quezon City’s Green Transport Office Bike Patrol
–
Bike parking at SM Masinag
With the increasing popularity of cycling, particularly the utilitarian kind (i.e., bike-to-work, bike-to-school, bike-to-shop, etc.), there is also the increasing need to provide facilities for cycling. Aside from the obvious (i.e., bike lanes), there are also what are termed as end-of-trip facilities, the most basic of which are parking. These may be spaces or slots allotted at workplaces, schools, markets, malls, government buildings, churches, etc. for cyclists or bikers to secure their vehicles. Bicycles may also be used as ‘last mile’ modes of transport so bike parking are necessary at transit or train stations. It is heartening to see the big malls like SM and Robinsons provide parking facilities for bicycles. Here are some photos of the bike station at SM City Masinag in Antipolo City.
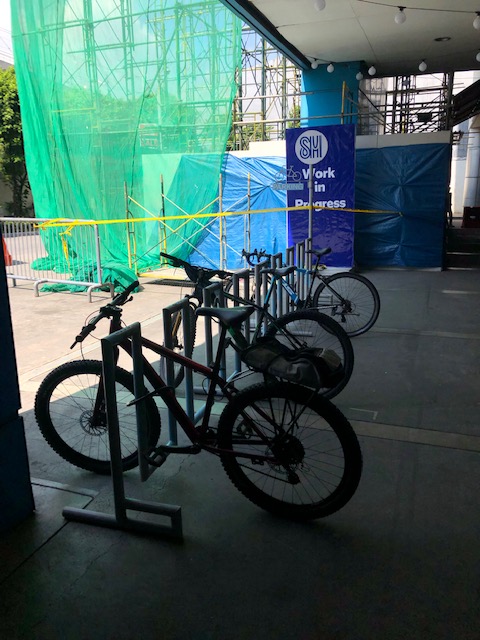 End of trip facilities in the Philippines is generally a work in progress. Hopefully, we get to benefit from their provision where they are needed – workplaces, schools, government buildings, commercial establishments, etc.
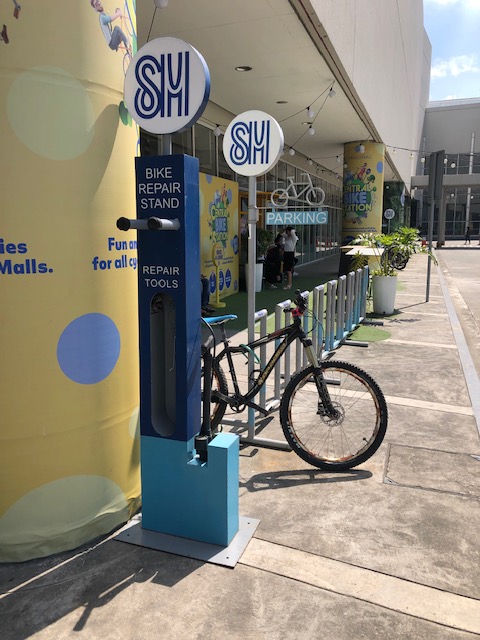 The bike station at SM Masinag includes this bike repair stand with the basic tools for bike repairs and tire inflation.
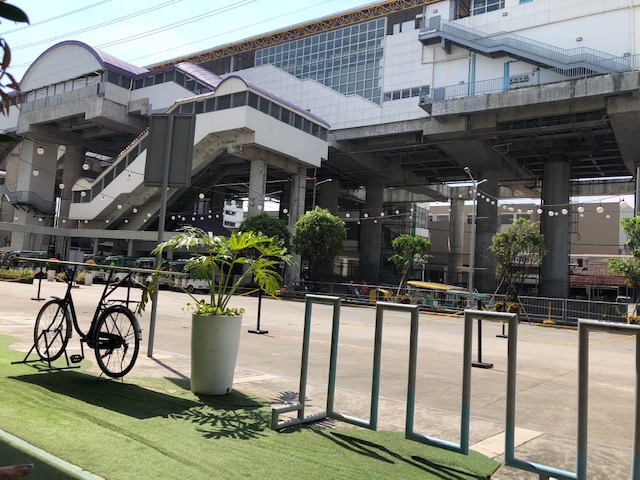 The bike station is just across from the Line 2 Antipolo Station (what was supposed to be called Masinag Station).
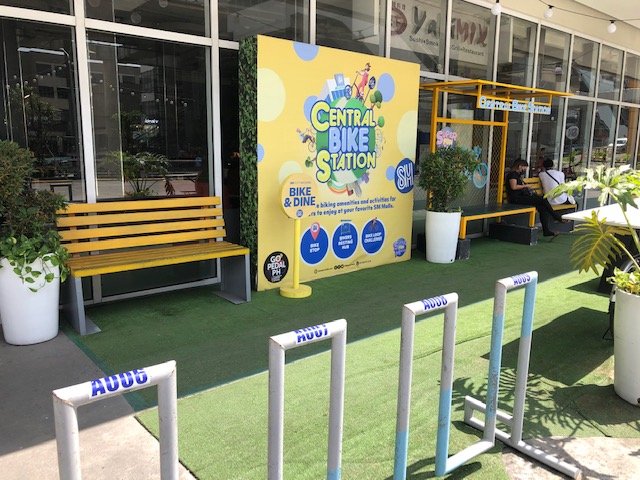 The central bike station also has benches for those who might want a rest and tables for those who want to “bike and dine”.
–
On bicycles vs. self driving cars
You’ve probably seen this graphic, the top part of which is attributed to the Cycling Promotion Fund. The last image is reproduced in the lower part of the image but labeled to emphasize what space is required to transport 48 people on electric cars and autonomous or self-driving cars.
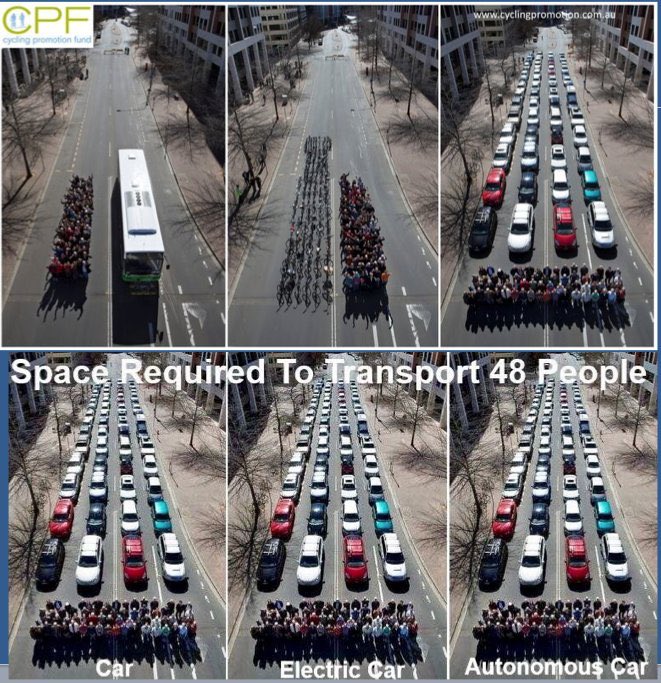
It is quite obvious that even if the current fleets of cars are replaced by electric and self-driving models, they will practically be the same problem in terms of road space occupied and the resulting congestion. So perhaps e-cars or autonomous cars are not really the solution we are looking for.
There is this nice article where the author articulates the how bikes (and active transport in general) should be the a more essential part of future transport and society than the automobile:
Collignon, N. (September 9, 2022) “Bikes, not self driving cars, are the technological gateway to urban progress,” Next City, https://nextcity.org/urbanist-news/bikes-not-self-driving-cars-are-the-technological-gateway-to-progress [Last accessed: 9/16/2022]
There are two quotable quotes from the article that I want to highlight here:
“Today the potential benefits from cycling on health, congestion, pollution and CO2 emissions are crystal clear and increasingly quantifiable, but the benefits of self-driving vehicles remain hazy. When ride-hailing companies like Uber and Lyft promised lower congestion and reduced car ownership, they instead increased congestion and led to a decline in transit ridership.”
and
“The concept of “jaywalking,” for example, is integral to the “car technology” of today. The crime of crossing a street without respecting the dominance of cars was invented by the car industry in the 1920s, who pushed hard to define streets as a place for cars, not people. Our car technology today is also defined by the restriction of movement it imposes on people.
When we begin to see technology through the lens of systems, it becomes clear that genuine technology-led progress will focus on dealing with the accelerating complexity of today’s world, not increasing the complexity of our tools.”
–
On the impacts of bicycle use
I’ve probably read a lot of posts on social media advocating for bicycle use. Here is another article that provides us with evidence about the impacts of cycling on travel, emissions and health:
Timmer, J. (August 20, 2022) “Here’s What Happens When Countries Use Bikes to Fight Emissions,” Wired, https://www.wired.com/story/bike-more-curb-global-emissions/ [Last accessed: 8/24/2022]
To quote from the article:
“Globally, adopting a Danish level of bicycle use would reduce annual emissions of CO2 by 414 million metric tons, approximately equivalent to the UK’s emissions in 2015. Boosting that to a Dutch level would eliminate nearly 700 million metric tons, or most of the emissions from Germany in that year.
The researchers also noted that countries like the Netherlands and Denmark have much lower rates of obesity than their peer countries. Based on the known health risks there, they estimate that, globally, we’re already avoiding 170,000 deaths annually due to cycling. Expanding this globally, they found that Denmark-equivalent bicycle use would prevent 430,000 deaths per year. Dutch levels of cycling would prevent 780,000 deaths.
That said, the vulnerability of cyclists to cars poses its own lethal risks. But these aren’t anywhere close to outweighing the benefits from exercise and lower obesity. (They’d add about 90,000 and 160,000 additional deaths per year for the two levels of use.) And if fewer drivers are using cars, there’s a chance that those numbers would come in even lower.
It’s worth noting that these numbers almost certainly underestimate the benefits of shifting to bikes. Bicycles use far fewer resources to produce, and they last longer than most cars. Maintenance is likely to be far less resource-intensive as well. So simply focusing on the use of the bike omits a lot of things that would show up in a detailed life-cycle analysis.
The researchers are certainly correct that there are a lot of locations where weather makes cycling a less-than-ideal option—and the range of places where heat makes it a positively dangerous option is expanding in our changing climate.
But some of the other issues are less severe than they might appear at first. For example, the advent of bicycles with electric assist means that hilly locales aren’t necessarily the barrier they might have been a decade ago. And while a number of countries have large open spaces where cars will remain a necessity, the trend toward urbanization means that most people in those countries will live in places where cycling can be made an option.
So, the biggest barrier is likely to remain the social will to rethink transportation.”
Indeed, social will (as well as political will) is perhaps the biggest barrier in our country. Many people may not agree but the evidence for this is so clear and obvious that one has to be naive or oblivious to not see it. How else will one explain people sticking to their cars and more readily shifting to motorcycles rather than the bicycle. Of course, there are other factors to be considered and the article actually cites wealth and geography as strong prerequisites in developing a cycling culture. We need to do much more to determine where interventions are needed including land use planning and land development as well as the provision of affordable housing closer to workplaces, schools, shops and other places of interest (Hello 10- or 15-minute cities!).
–
