
Home » Posts tagged 'bicycles' (Page 2)
Tag Archives: bicycles
On the impacts of bicycle use
I’ve probably read a lot of posts on social media advocating for bicycle use. Here is another article that provides us with evidence about the impacts of cycling on travel, emissions and health:
Timmer, J. (August 20, 2022) “Here’s What Happens When Countries Use Bikes to Fight Emissions,” Wired, https://www.wired.com/story/bike-more-curb-global-emissions/ [Last accessed: 8/24/2022]
To quote from the article:
“Globally, adopting a Danish level of bicycle use would reduce annual emissions of CO2 by 414 million metric tons, approximately equivalent to the UK’s emissions in 2015. Boosting that to a Dutch level would eliminate nearly 700 million metric tons, or most of the emissions from Germany in that year.
The researchers also noted that countries like the Netherlands and Denmark have much lower rates of obesity than their peer countries. Based on the known health risks there, they estimate that, globally, we’re already avoiding 170,000 deaths annually due to cycling. Expanding this globally, they found that Denmark-equivalent bicycle use would prevent 430,000 deaths per year. Dutch levels of cycling would prevent 780,000 deaths.
That said, the vulnerability of cyclists to cars poses its own lethal risks. But these aren’t anywhere close to outweighing the benefits from exercise and lower obesity. (They’d add about 90,000 and 160,000 additional deaths per year for the two levels of use.) And if fewer drivers are using cars, there’s a chance that those numbers would come in even lower.
It’s worth noting that these numbers almost certainly underestimate the benefits of shifting to bikes. Bicycles use far fewer resources to produce, and they last longer than most cars. Maintenance is likely to be far less resource-intensive as well. So simply focusing on the use of the bike omits a lot of things that would show up in a detailed life-cycle analysis.
The researchers are certainly correct that there are a lot of locations where weather makes cycling a less-than-ideal option—and the range of places where heat makes it a positively dangerous option is expanding in our changing climate.
But some of the other issues are less severe than they might appear at first. For example, the advent of bicycles with electric assist means that hilly locales aren’t necessarily the barrier they might have been a decade ago. And while a number of countries have large open spaces where cars will remain a necessity, the trend toward urbanization means that most people in those countries will live in places where cycling can be made an option.
So, the biggest barrier is likely to remain the social will to rethink transportation.”
Indeed, social will (as well as political will) is perhaps the biggest barrier in our country. Many people may not agree but the evidence for this is so clear and obvious that one has to be naive or oblivious to not see it. How else will one explain people sticking to their cars and more readily shifting to motorcycles rather than the bicycle. Of course, there are other factors to be considered and the article actually cites wealth and geography as strong prerequisites in developing a cycling culture. We need to do much more to determine where interventions are needed including land use planning and land development as well as the provision of affordable housing closer to workplaces, schools, shops and other places of interest (Hello 10- or 15-minute cities!).
–
On bike counts – Part 1
Bike counts are being conducted this June and July in many cities around the country to mainly determine the number of cyclists in various locations in the participating cities and if there was an increase in the numbers. An increase will be encouraging and should support the upgrading and expansion of the bike lanes network established during this pandemic (we are not yet in the post-Covid-19 age).
The following Images are from the Mobility Awards Facebook Page where you can find the rationale for these surveys. Vehicle or pedestrian counts are perhaps the most basic type of surveys and are conducted over certain periods of time to establish variability as well as seasonality. In the case of most if not all the counts mentioned below, surveys were and are to be conducted during the perceived peak periods for bike traffic: 6:00 to 8:00 AM and 4:00 to 6:00 PM.




Counts like these need to be evaluated or analyzed considering various contexts. While the outcomes of such counts are often presented from the point of view of advocates and there is a tendency to play with the numbers (which I will explain in more detail in succeeding posts), the bigger picture relating bike numbers to other modes of transport would be among the most important. Trip purpose is another essential factor to be considered. And there is also data on the origin-destination characteristics of trips. Historical or time series data is also important if trends are to be established.
By itself, these bicycle counts are very important data that will ultimately be useful for planning, design and construction of facilities for active transport. The lack of data on bicycles while there is a bias for motor vehicle data means we cannot see the complete picture and therefore remain car-centric when dealing with transportation issues.
–
Star ratings for bicycles
I just wanted to do a quick share of a new method for evaluating road and bicycling infrastructure – cycleRAP. This was developed by the International Road Assessment Program (iRAP), which has established a star rating system as the international standard for road safety assessments. We currently use their Star Ratings for Schools (SR4S) to evaluate the school environment towards ensuring safe journeys for school children. Here’s the link to their website:
To quote from the site: “CycleRAP is an easy, affordable and fast method of evaluating road and bicycling infrastructure for safety. It aims to reduce crashes and improve safety specifically for bicyclists and other light mobility users by identifying high risk locations without the need for crash data.”
–
On floods, transport and traffic, again
It’s that time of year again when the heavy rains lead to flash floods along many roads. I took the following photo as we slowly progressed towards Cainta Junction early this week. The Felix Avenue approach was flooded after more than an hour of heavy rains fell upon Cainta and neighboring towns. We learned later that the rains fell on a larger area as EDSA and other major road in Metro Manila also experience flash floods. These cause traffic to slow down if not outright stoppage. Many commuters can get stranded when PUVs are not able to run due to the floods. Deeper waters mean light vehicles including motorcycles and bicycles cannot proceed along certain roads, further exacerbating the traffic situation.
 Motorcyclists emerge from their shelters to travel along flooded roads. A common sight when there are downpours are motorcyclists huddling under overpasses, bridges, or whatever shelter may be available to them. Many bring rain gear but opt to just stop and wait it out until the rain stops.
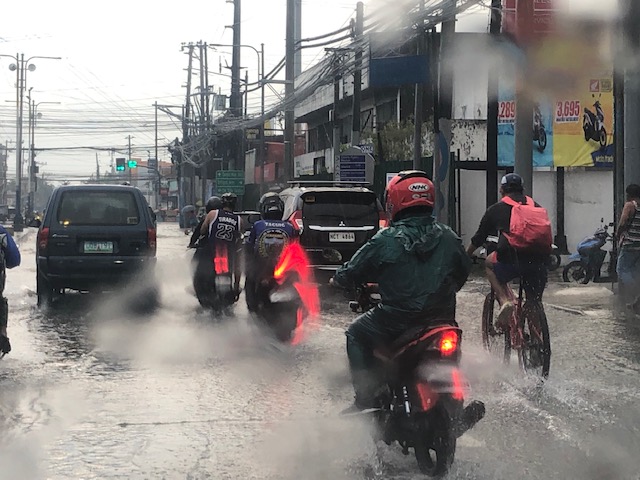 A cyclist braves the floods – while pedestrians will likely stop and wait it out for the rains to stop or for the floods to subside, cyclist might just pedal on. They just have to be more careful as potholes and other dangers may be hidden by the floodwaters.
 Cainta Junction has been submerged by so many floods over so many years. Even with the new drainage constructed under and along Ortigas Avenue Extension, Felix Avenue and Bonifacio Avenue, it seems their capacities are not enough to handle the rainwaters. That or perhaps their intakes need to be redesigned to more efficiently take on the heavy rains and the resulting runoff.
–
Suffering and salvation for transport and traffic
I shared the following photo on social media with the label “Kalbaryo at Kaligtasan”:
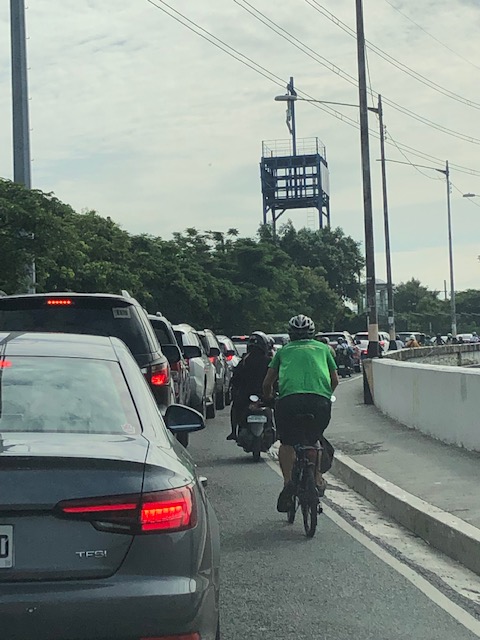 Cyclist pedaling ahead of cars queueing along the C5 ramp towards BGC
The label or title has double meaning. Conspicuous in the photo is the image of the Crucifixion atop what is a small shrine along Circumferential Road 5 across and facing SM Aura. The image appears to be a reminder or symbol of suffering but with the superimposed image of traffic congestion, alludes to the suffering endured by motorists on a daily basis. The “kaligtasan” or salvation part of the photo is in the form of the cyclist or the bicycle (I really have to explain that, right?) that offers an alternative or even hope for those who seek it. One thing the pandemic has taught us is that active transport in the form of walking or cycling is part of the solution to the transport problems we are experiencing. Public transport, of course, is touted as an ultimate solution but the reforms and infrastructure required are and will take time to implement, and these are already encountering problems leading to further delays or ineffectiveness.
–
The case for bike lanes
There is a strong push for more bike lanes to be developed along both major and minor roads. Many pop-up bike lanes that were implemented and permanent bike lanes constructed in 2020, mostly during the lockdowns, to address the needs of ‘frontliners’ who opted to bike to work have been retained and even upgraded to adhere to guidelines issued by the DPWH. While these bike lanes are not yet as comprehensive as desired and most are not the protected types, recent developments have threatened their existence and consequently the safety of cyclists (especially bike-to-work) and the promotion of cycling as a primary mode of transport.

We need to transform our streets where it is possible in order to take advantage of the increasing popularity of cycling that has convinced some people to select cycling at least for their last mile trips and hopefully for the most part(s) of their commute. From a transport planning perspective, we should also determine if these mode shifts can be sustained and perhaps increased with proper integration of public transport and active transport thrusts.
The recent removal of protected bike lanes or barriers that serve to protect cyclists using the lanes in some cities are examples of regression rather than progression. These come as a surprise as these cities have made leaps and bounds so to speak in developing their bike lane networks. Where did the orders to do so originate and are staffs of these cities communicating, discussing and coordinating these actions? Apparently, there are internal conflicts and perhaps, I dare say here, politics involved. It is also possible that within LGUs, the concepts, visions and plans for transportation are not harmonized or understood making one project by one clique unacceptable to another or others. I know from personal experiences that LGU traffic engineering & management and operations staff are often not in synch with their planning counterparts. This is not and should not be a given since both need to collaborate in order to address transport and traffic issues that need more comprehensive and progressive approaches compared to what have been practiced before.
LGUs cannot rely on strategies and tactics that are along the lines of “ganito na ginagawa noon pa” or “ganito na inabutan ko”, which only proves these were ineffective (i.e., why not try other techniques, methods or strategies instead?). Transformations and paradigm changes to solve transport problems cannot be achieved by denying the change, innovation or new ideas required for emerging as well as persistent issues/problems.
–
Bike lanes at BGC
We were at the Bonifacio Global City (BGC) a couple of weeks ago after almost two years of not going there mainly due to the pandemic. We frequented BGC before especially since my wife’s office is there and, if it weren’t for the ‘old normal’ traffic, the place offered a lot in terms of restaurants and shops. When traffic wasn’t as bad, we even had our Saturdays there with our daughter as her Kindermusik sessions were originally there before we transferred to their branch at The Grove. It’s not yet post-pandemic but traffic is back to ‘old normal’ levels.
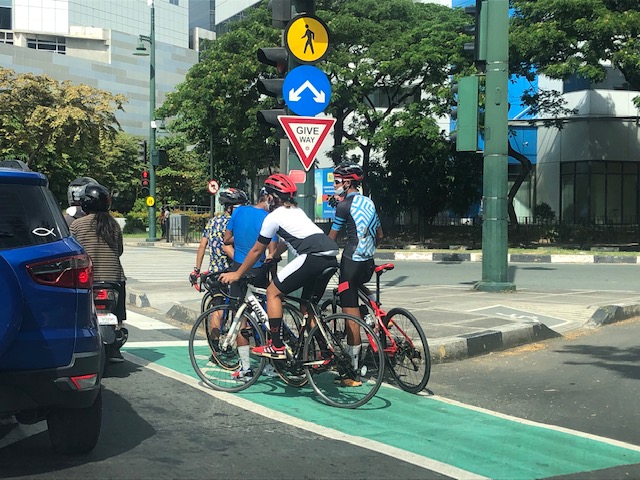
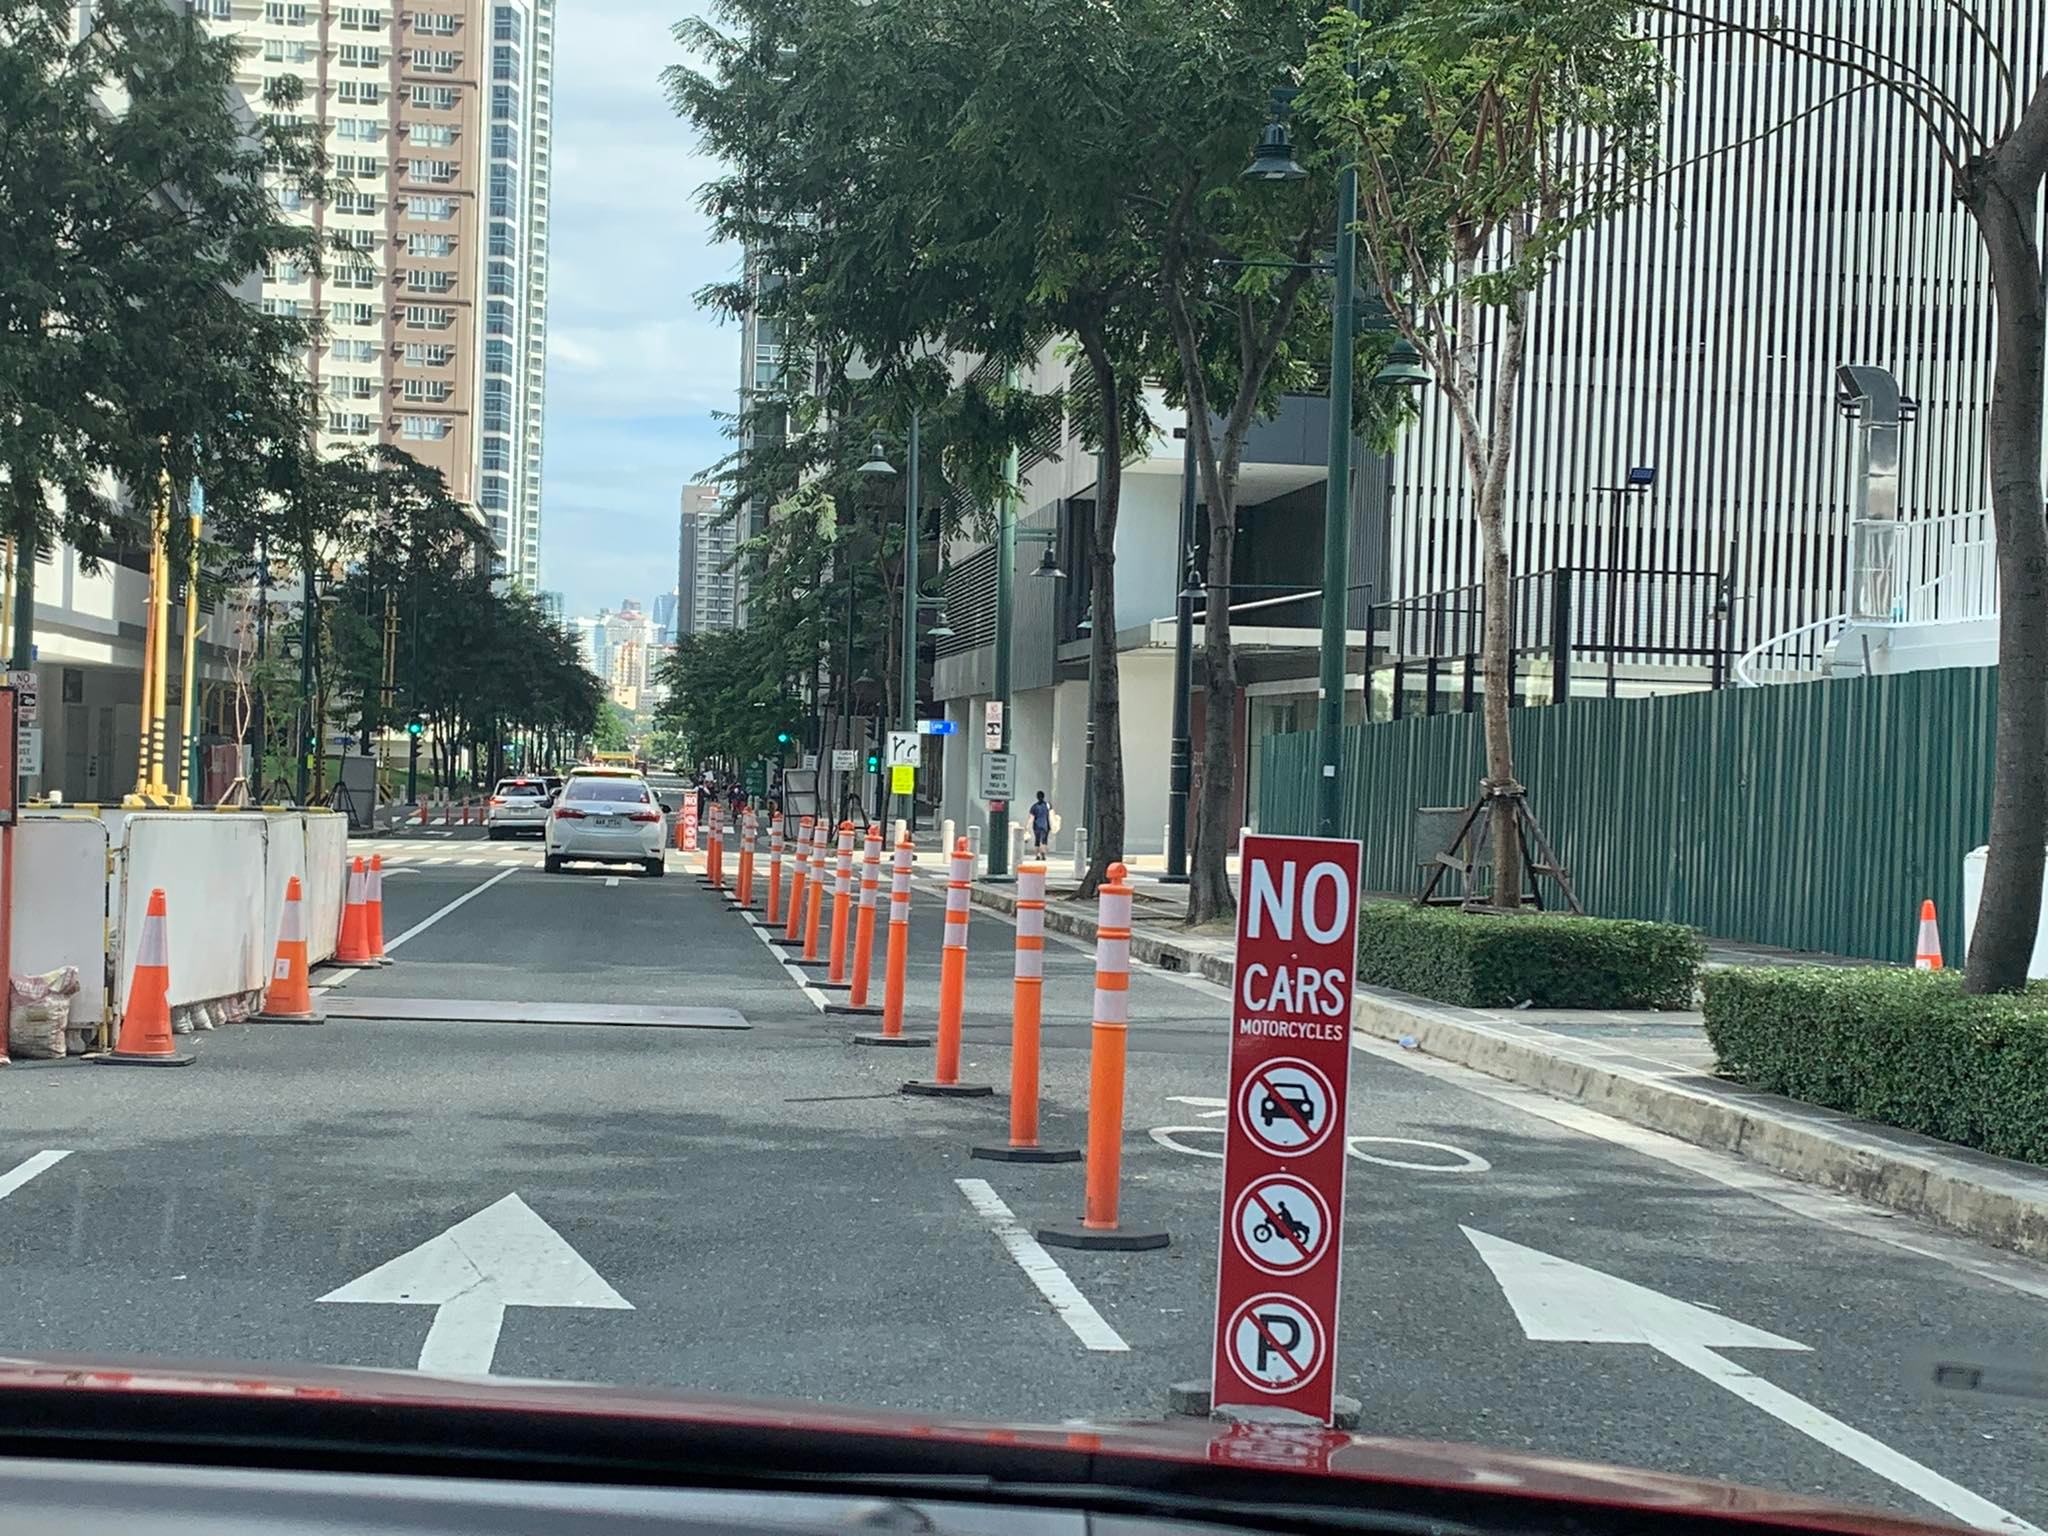
I was expecting to see the bike lanes along C5 and at BGC when we traveled there. I will post separately about the bike lanes along C5. I just wanted to share here a few photos the wife took of the bike lanes at BGC. It is truly a welcome development not just here but in many places across the country where cycling offers another option for trips of various purposes including commuting between homes and workplaces. The protected lanes along 9th Avenue are wide and can be replicated elsewhere in order to encourage more people to use bicycles. The connectivity of bike lanes, though, leaves much to be desired if one expects people to use bikes for longer trips.


–
On why people are afraid to bike
There is an interesting graphic shared by a friend on his social media account. I am also sharing it here. The source may be found at the bottom right of the graphic.

I think the graphic speaks for itself. How can we encourage people to bike whether for commuting or other utilitarian purpose if there are nuts behind the wheels of many motor vehicles? All the points raised in the graphic are true for the Philippines and are not limited to drivers of private vehicles. These are also the same for public transport drivers as well. And these cannot be solved or addressed overnight. You have to get to the roots of the problem, which are about the driver and rider education (i.e., training), and the licensing system of the Land Transportation Office (LTO).
While there are driving and riding schools that have proliferated, many seem to just go through the motions of driver and rider education. Prospective motor vehicle drivers and riders often just learn enough to pass a flawed examination to get their licenses. Do they really learn about how to behave properly when driving or riding? It certainly does not show with how they deal with cyclists and pedestrians. As for enforcement, well that’s another topic to discuss in a separate post.
–
On the other benefits of cycling – pavements
Here is a very interesting article that tackles a not so obvious benefit of switching to cycling:
Dion, R. (July 12, 2021) “Biking’s Billion-Dollar Value, Right Under Our Wheels,” Planetizen, https://www.planetizen.com/features/113986-bikings-billion-dollar-value-right-under-our-wheels?utm_source=newswire&utm_medium=email&utm_campaign=news-07262021&mc_cid=51555c9a39&mc_eid=9ccfe464b1 [Last accessed: 8/4/2021]
To quote: “A strategic switch to biking would dramatically reduce the depth of roads, saving untold billions over the next generation.”
This is relevant from the perspective of highway engineering particularly concerning pavement design, construction and maintenance. It is intriguing, too, since pavement design (and consequently pavement thickness) is not necessarily correspondent to light vehicle traffic volumes. In the Philippines, for example, only heavy vehicles are considered for the pavement load estimation. It is assumed that light vehicle traffic, which compose most of the traffic along roads contribute mainly to pavement weathering rather than structural aspects.
–
On ‘high-tech’ bike tires
Here’s another recent article about tires developed by NASA for their rovers. Obviously, the objective was to eliminate flat tires when you send them out to explore other planets or moons. The applications here, however, will have a big impact on vehicles including bicycles that have increased popularity in the last year partly due to the pandemic. These might definitely become game-changers particularly for those who bike commute.
Golson, J. (March 23, 2021) “These NASA-developed bike tires could be the last you ever buy,” Inverse, https://www.inverse.com/innovation/these-nasa-developed-bike-tires-could-be-the-last-you-ever-buy [Last accessed: 3/25/2021]
I had posted about the tires on my father-in-law’s newly acquired pedal assist electric bike. Here is what it looks like. Of course, rubber is still the basic material here so perhaps this will be replaced by more durable (indestructible?) material stated in the article above.

–

