
Home » active transport (Page 10)
Category Archives: active transport
Bike lanes at the UP Diliman campus – Part 2
The bike lanes in UP Diliman are not limited to the Academic Oval. There are now also bike lanes along other major roads including Magsaysay Avenue, which is road immediately after the portal at the Asian Center and allowing direct entrance and exit via Katipunan Avenue (C-5). The bike lanes are along either side of Magsaysay Avenue and are of Class II – Type B (separated bike lanes) but there are no LED markers that are ideally placed along the delineation for the bike lanes.
 Painted bike lanes along Magsaysay Avenue, which is the road behind Malcolm and Melchor Halls. To the left is the Department of Mechanical Engineering Building and the Computer Center. To the right is the Resilience Institute.
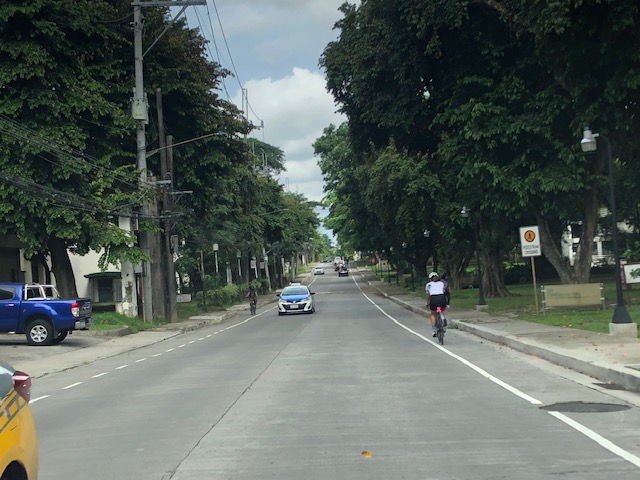 To the right is what used to be the Chemical Engineering Lab behind Melchor Hall. To the right is the Ipil and Yakal Dormitories.
–
Counting cars…and other vehicles as well
I saw a couple of these counting instruments set-u by the DPWH, one along Ortigas Avenue Extension and another along Sumulong Highway. These are mobile counting machines that are used to count vehicles along both directions of the roads. These are supposed to be calibrated to be able to distinguish among the various types of vehicles using the roads. I assume the classifications would be according to the types used by the DPWH and not simply a general count of the number of vehicles. I wonder though if these can accurately count smaller vehicles like motorcycles, bicycles and PMD’s like the one in the photo below.

If these can be calibrated to count bicycles and PMDs, it would allow for the establishment of baseline numbers and expansion or seasonal factors for what are now termed as micromobility modes. The recent bicycle counts done through volunteers and during peak hours cannot be expanded simply because there are no reference factors that can be used for this purpose. The available expansion or seasonal factors with DPWH derived from 24-hour counts at strategic locations along national roads only account for motor vehicles. These cover the variations of motor vehicle traffic over long periods of time (e.g., 24/7) that allows one to determine Annual Average Daily Traffic (AADT) as well as typical traffic during certain days of a week (e.g., traffic on a Monday or a Sunday).
–
On the benefits of developing and investing in active and public transportation
Here is another quick share of an article with a very relevant and timely topic – the business case for multimodal transport planning:
Litman, T. (July 2022) “The Business Case for Multimodal Transportation Planning,” Planetizen, https://www.planetizen.com/blogs/117697-business-case-multimodal-transportation-planning?utm_source=newswire&utm_medium=email&utm_campaign=news-07142022&mc_cid=03c159ebcf&mc_eid=9ccfe464b1 [Last accessed: 7/15/2022]
To quote from the article:
“Conventional planning tends to undervalue non-auto mode improvements by assuming that each additional mile of their travel can reduce, at best, one vehicle mile traveled. In fact, in many situations they can leverage much larger reductions in vehicle travel, meaning that each additional mile of walking, bicycling, or public transit can reduce more than one vehicle mile … As a result, walking, bicycling and public transit improvements can provide much larger vehicle travel reductions and benefits than is commonly recognized.”
There is a box referred to in the preceding quote. I will not reproduce it here so I leave it up to the reader to go to the original article by Litman to find out how active and public transport can leverage additional travel reductions. Understanding these and the extend by which we can be independent of car-use (referring to non-car travel demand) will allow for a better appreciation, travel-wise and economics or business-wise, of the advantages of developing and investing in active and public transportation infrastructure and services.
–
Bike lanes at the UP Diliman campus – Part 1
I had first read about the enhanced bike lanes at the UP Diliman Academic Oval last month from a social media post of a friend. She was present as the delineations of the jogging and cycling lanes were being painted along with the baybayin marks distinguishing UP’s bike lanes from others like it. UP’s bike lanes predate the current ones around Metro Manila that mostly popped-up during the pandemic.
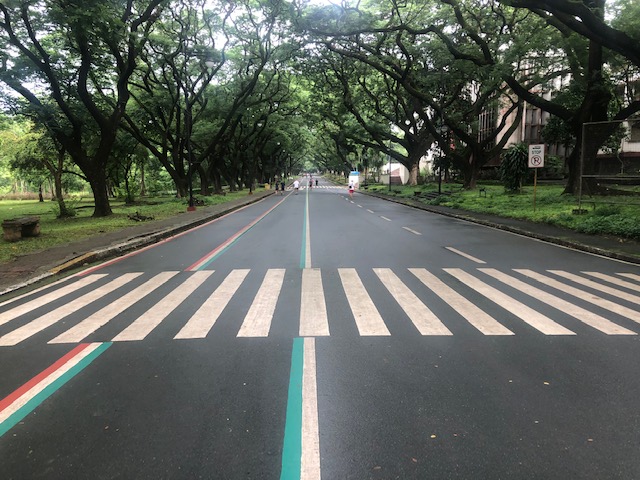 The Academic Oval road original had two-way traffic along its wide carriageway, that could easily fit 4 lanes. Since it became a one-way, counterclockwise road, the lanes had been divided into 3 wide lanes with one lane initially committed to bicycles.
 Here are the two lanes designated for joggers/walkers (curbside) and cyclists (median). The pedestrian sidewalk was originally planned to be widened in time for UP’s Centennial celebration back in 2008. That did not materialize. The Academic Oval could have had wider sidewalks for those who are not walking for exercise.
 The section in front of Melchor Hall features the words bicycles or bike lane and pedestrian in baybayin. Its certainly a novelty for now and something probably apt for the campus roads but not necessarily for others.
 A closer look at the baybayin script along the jogging/walking and bike lanes.
 Here’s the bigger picture on the pavement markings.
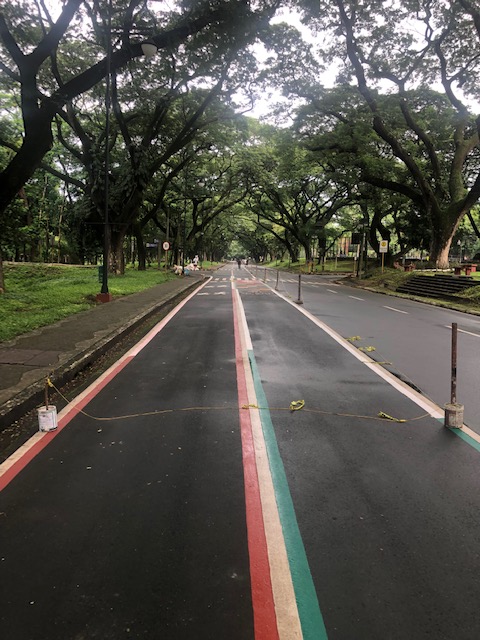 Approach to an intersection
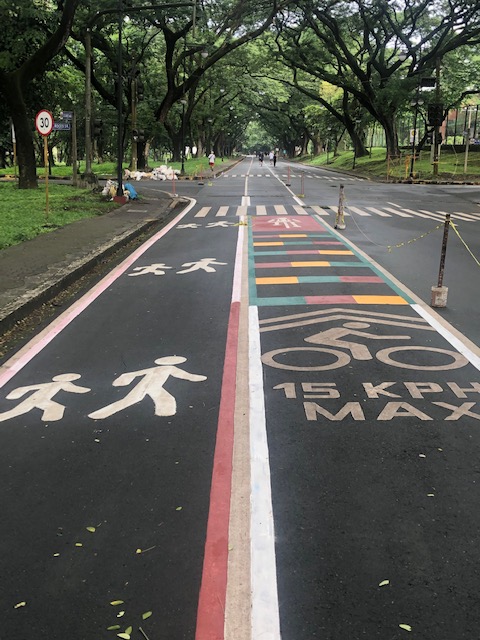 The UP colors inform riders about the intersection ahead. These are more visual as they are flat and not rumble strips. The older pavement markings advising riders of the speed limit should be seen in the context of utilitarian cycling (e.g., bike to work, bike to school) rather than cycling for fitness or recreation, which obviously may involve higher speeds and is frowned upon along the oval.
 The intersection approach from another angle.
The Academic Oval bike lane is one of the original recommendations of a transport study conducted for the campus about 17 years ago. The study was the basis for the campus being declared as a road safety zone, which among others included a provision for its roads to have a 30-kph speed limit. The one-way counter-clockwise traffic circulation and the jogging and bike lanes, however, are officially a part of what has become a long-term experiment on campus. There are many who oppose the one-way scheme and are vehement against the ultimate plan to have the Academic Oval car-free or car-less (it is mostly car-less during Sundays – part of the “experiment”).
The other new bike lanes on campus in Part 2 of this series.
–
On bike counts – Part 1
Bike counts are being conducted this June and July in many cities around the country to mainly determine the number of cyclists in various locations in the participating cities and if there was an increase in the numbers. An increase will be encouraging and should support the upgrading and expansion of the bike lanes network established during this pandemic (we are not yet in the post-Covid-19 age).
The following Images are from the Mobility Awards Facebook Page where you can find the rationale for these surveys. Vehicle or pedestrian counts are perhaps the most basic type of surveys and are conducted over certain periods of time to establish variability as well as seasonality. In the case of most if not all the counts mentioned below, surveys were and are to be conducted during the perceived peak periods for bike traffic: 6:00 to 8:00 AM and 4:00 to 6:00 PM.




Counts like these need to be evaluated or analyzed considering various contexts. While the outcomes of such counts are often presented from the point of view of advocates and there is a tendency to play with the numbers (which I will explain in more detail in succeeding posts), the bigger picture relating bike numbers to other modes of transport would be among the most important. Trip purpose is another essential factor to be considered. And there is also data on the origin-destination characteristics of trips. Historical or time series data is also important if trends are to be established.
By itself, these bicycle counts are very important data that will ultimately be useful for planning, design and construction of facilities for active transport. The lack of data on bicycles while there is a bias for motor vehicle data means we cannot see the complete picture and therefore remain car-centric when dealing with transportation issues.
–
A Bike Master Plan for Metro Manila, Metro Cebu and Metro Davao
Before Active Transport Week concludes this weekend, I would just like to share this collage from one of our staff at the National Center for Transportation Studies of the University of the Philippines Diliman. It is about the Master Plan developed for the three metropolitan areas in the country – Metro Manila, Metro Cebu and Metro Davao. I will share more details about this soon including a link or links to where you can download a copy of the plan.

The project concluded recently with the submission of the Final Report but most important is the Master Plan document that can serve as a reference for further development of bike lanes in the metropolises. I’ve seen the Master Plan and many of its provisions and recommendations can easily be adopted or is replicable in other cities and municipalities in the country. Perhaps, there should be a National Master Plan?
–
Bike lanes at Bonifacio Global City
After settling down at our new ‘tambayan’ at BGC, I decided to take my regular morning walk around the area to familiarize myself with the environs and to establish a route that I and the wife would likely be taking for our constitutionals whenever we are staying at BGC. I took the following photos of the bike lanes along 38th Street where most of the locators are international schools.
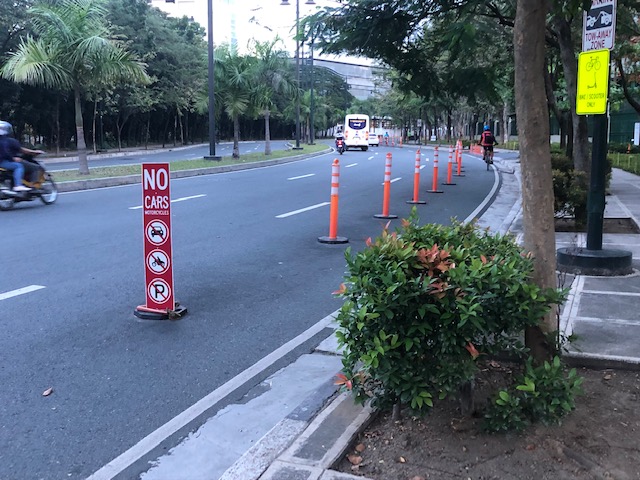
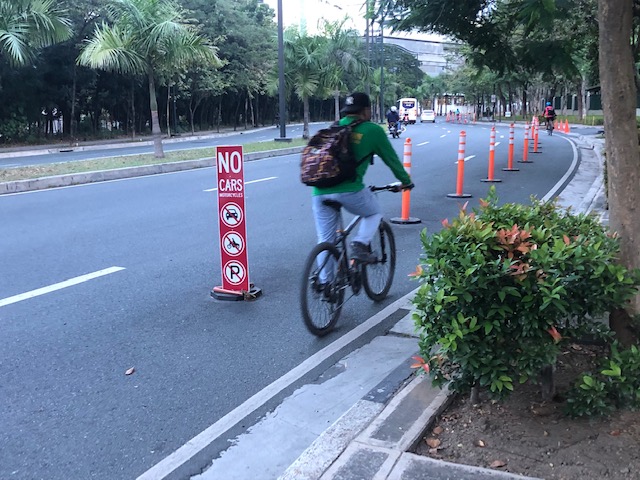
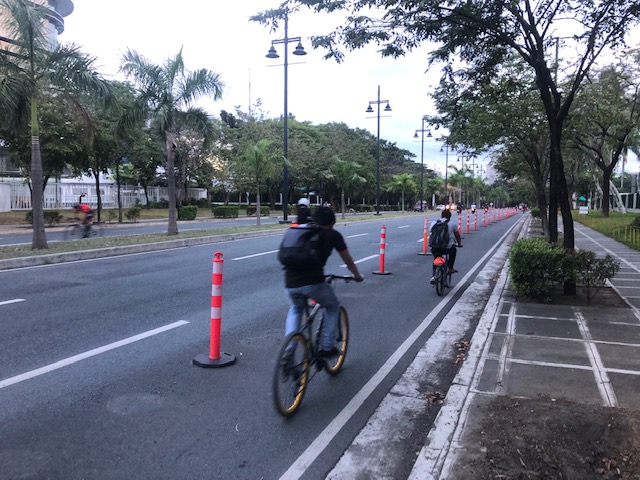
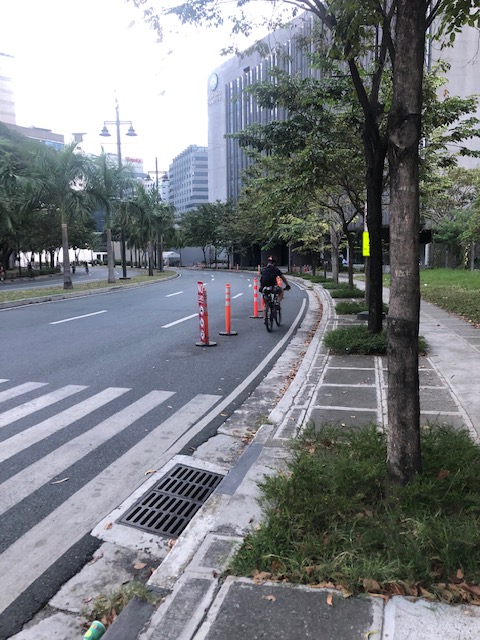
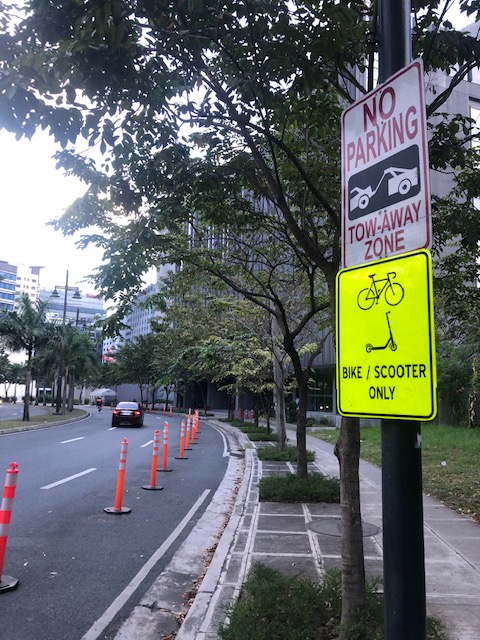
During Saturday and Sunday mornings, the bollards are moved to the sidewalk as many cyclists use 38th Street for laps. I wonder if the bike lanes will be retained once the schools resume face-to-face classes. That would mean a tremendous number of private vehicles generated by the international schools and colleges here. My opinion is that the bike lanes need to be retained as it is a step in the right direction for transport and encourages people to cycle or take PMDs to work and perhaps to school. These and others like it in Metro Manila and around the country need to be sustained and further developed to be attractive and viable to many seeking another option for mobility and their regular commutes.
–
Star ratings for bicycles
I just wanted to do a quick share of a new method for evaluating road and bicycling infrastructure – cycleRAP. This was developed by the International Road Assessment Program (iRAP), which has established a star rating system as the international standard for road safety assessments. We currently use their Star Ratings for Schools (SR4S) to evaluate the school environment towards ensuring safe journeys for school children. Here’s the link to their website:
To quote from the site: “CycleRAP is an easy, affordable and fast method of evaluating road and bicycling infrastructure for safety. It aims to reduce crashes and improve safety specifically for bicyclists and other light mobility users by identifying high risk locations without the need for crash data.”
–
How can e-scooters become a safer way to travel?
I’ve shared some articles and opinions about electric scooters. Here is another one that delves into the safety about these vehicles that have become quite popular in the US. Here in the Philippines, they still seem to be in infancy in terms of popularity and to some, are seen as more a novelty and touristy rather than a mode of transport for the typical work trips.
Donahue, B (June 11, 2022) “How to Make Electric Scooters Become a Safer Way to Travel,” Bloomberg, https://www.bloomberg.com/news/features/2022-06-11/how-to-make-electric-scooters-safer [Last accessed: 6/18/2022]
To quote from the article:
“Dediu believes that in time micromobility will attain critical mass, as other modes of transit have already done, and that infrastructure will come as the user base grows. “We didn’t build airports and then have airplanes show up,” he’s said. “I’m confident, given the history, that we’ll see things like more safe roadways for micromobility vehicles.” “
 Scoot-to-work at BGC, Taguig, Metro Manila
It is not really about the vehicle but the environment in which it is being used. One can say a lot about walking, for example, being dangerous but without touching on the why and the how its become a dangerous or risky mode of travel. It’s the lack of infrastructure or facilities as well as the car-oriented environment (that includes archaic laws and other regulations) that make active mobility and micro mobility modes dangerous or risky. If we can address these basic issues, then perhaps we can entice more people to use these modes more often and for the most trips we make everyday.
And don’t forget that these modes are the most fuel efficient! Saves you from the every increasing prices of fuel!
–
Micromobility anyone?
I just wanted to share a couple of photos I took en route to BGC last week. Yes, the traffic is already terrible and yes, I drove to BGC (or more accurately, I was driven as we were hauling stuff to our home away from home at BGC). I couldn’t help but take photos of the motorcycles and bicycles passing our vehicles. These were definitely more efficient forms of travel considering they require less space and likely incur less travel times. In addition to these modes (and walking, of course), there seems to be an increasing popularity for other micro mobilities. I wouldn’t define and enumerate these emerging modes but you’ve probably seen some of them along your commutes – electric kick scooters (EKS), gas-powered versions of these scooters, other forms of electric vehicles including trikes, etc. Here are a couple of examples I captured in photos last week.
 Cyclists and micro mobility users slugging it out with motor vehicles
E-scooter in BGC: comfy clothes-check! backpack-check! helmet-check! Commuting to work should be something like this rather than most people using their cars.
 Caught (up) in traffic