
Home » NMT (Page 5)
Category Archives: NMT
Bike lanes at the UP Diliman campus – Part 2
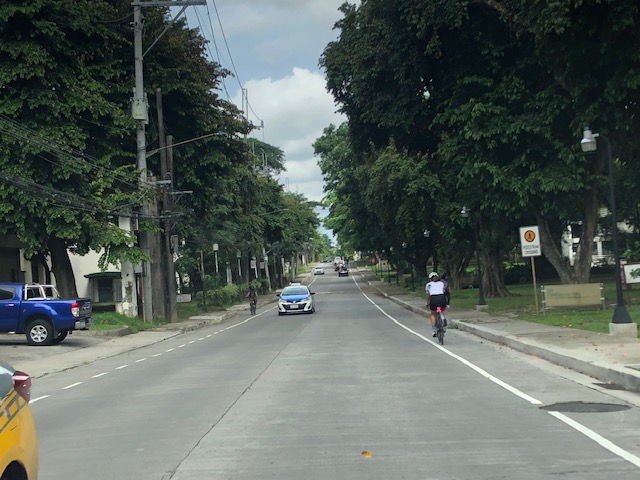
The bike lanes in UP Diliman are not limited to the Academic Oval. There are now also bike lanes along other major roads including Magsaysay Avenue, which is road immediately after the portal at the Asian Center and allowing direct entrance and exit via Katipunan Avenue (C-5). The bike lanes are along either side of Magsaysay Avenue and are of Class II – Type B (separated bike lanes) but there are no LED markers that are ideally placed along the delineation for the bike lanes.
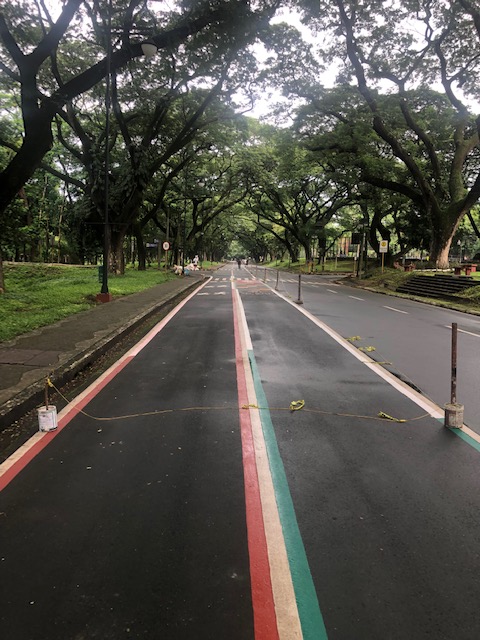
 Painted bike lanes along Magsaysay Avenue, which is the road behind Malcolm and Melchor Halls. To the left is the Department of Mechanical Engineering Building and the Computer Center. To the right is the Resilience Institute.
 To the right is what used to be the Chemical Engineering Lab behind Melchor Hall. To the right is the Ipil and Yakal Dormitories.
–
On the benefits of developing and investing in active and public transportation
Here is another quick share of an article with a very relevant and timely topic – the business case for multimodal transport planning:
Litman, T. (July 2022) “The Business Case for Multimodal Transportation Planning,” Planetizen, https://www.planetizen.com/blogs/117697-business-case-multimodal-transportation-planning?utm_source=newswire&utm_medium=email&utm_campaign=news-07142022&mc_cid=03c159ebcf&mc_eid=9ccfe464b1 [Last accessed: 7/15/2022]
To quote from the article:
“Conventional planning tends to undervalue non-auto mode improvements by assuming that each additional mile of their travel can reduce, at best, one vehicle mile traveled. In fact, in many situations they can leverage much larger reductions in vehicle travel, meaning that each additional mile of walking, bicycling, or public transit can reduce more than one vehicle mile … As a result, walking, bicycling and public transit improvements can provide much larger vehicle travel reductions and benefits than is commonly recognized.”
There is a box referred to in the preceding quote. I will not reproduce it here so I leave it up to the reader to go to the original article by Litman to find out how active and public transport can leverage additional travel reductions. Understanding these and the extend by which we can be independent of car-use (referring to non-car travel demand) will allow for a better appreciation, travel-wise and economics or business-wise, of the advantages of developing and investing in active and public transportation infrastructure and services.
–
Bike lanes at the UP Diliman campus – Part 1
I had first read about the enhanced bike lanes at the UP Diliman Academic Oval last month from a social media post of a friend. She was present as the delineations of the jogging and cycling lanes were being painted along with the baybayin marks distinguishing UP’s bike lanes from others like it. UP’s bike lanes predate the current ones around Metro Manila that mostly popped-up during the pandemic.
 The Academic Oval road original had two-way traffic along its wide carriageway, that could easily fit 4 lanes. Since it became a one-way, counterclockwise road, the lanes had been divided into 3 wide lanes with one lane initially committed to bicycles.
 Here are the two lanes designated for joggers/walkers (curbside) and cyclists (median). The pedestrian sidewalk was originally planned to be widened in time for UP’s Centennial celebration back in 2008. That did not materialize. The Academic Oval could have had wider sidewalks for those who are not walking for exercise.
 The section in front of Melchor Hall features the words bicycles or bike lane and pedestrian in baybayin. Its certainly a novelty for now and something probably apt for the campus roads but not necessarily for others.
 A closer look at the baybayin script along the jogging/walking and bike lanes.
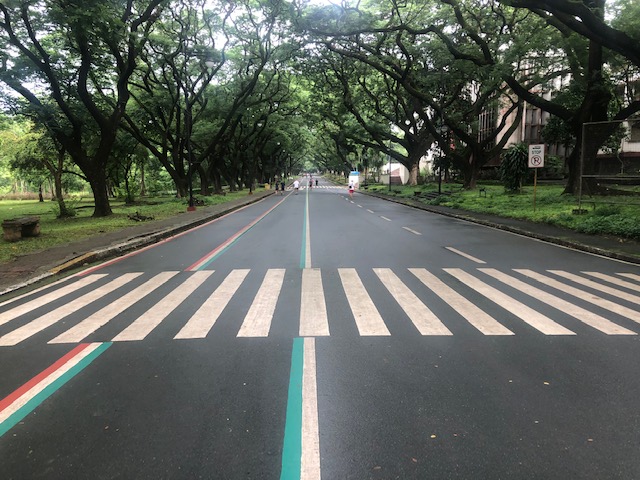
 Here’s the bigger picture on the pavement markings.
 Approach to an intersection
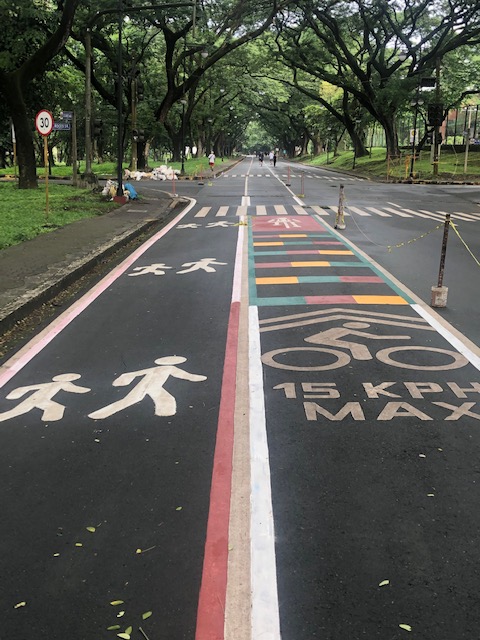 The UP colors inform riders about the intersection ahead. These are more visual as they are flat and not rumble strips. The older pavement markings advising riders of the speed limit should be seen in the context of utilitarian cycling (e.g., bike to work, bike to school) rather than cycling for fitness or recreation, which obviously may involve higher speeds and is frowned upon along the oval.
 The intersection approach from another angle.
The Academic Oval bike lane is one of the original recommendations of a transport study conducted for the campus about 17 years ago. The study was the basis for the campus being declared as a road safety zone, which among others included a provision for its roads to have a 30-kph speed limit. The one-way counter-clockwise traffic circulation and the jogging and bike lanes, however, are officially a part of what has become a long-term experiment on campus. There are many who oppose the one-way scheme and are vehement against the ultimate plan to have the Academic Oval car-free or car-less (it is mostly car-less during Sundays – part of the “experiment”).
The other new bike lanes on campus in Part 2 of this series.
–
On bike counts – Part 1
Bike counts are being conducted this June and July in many cities around the country to mainly determine the number of cyclists in various locations in the participating cities and if there was an increase in the numbers. An increase will be encouraging and should support the upgrading and expansion of the bike lanes network established during this pandemic (we are not yet in the post-Covid-19 age).
The following Images are from the Mobility Awards Facebook Page where you can find the rationale for these surveys. Vehicle or pedestrian counts are perhaps the most basic type of surveys and are conducted over certain periods of time to establish variability as well as seasonality. In the case of most if not all the counts mentioned below, surveys were and are to be conducted during the perceived peak periods for bike traffic: 6:00 to 8:00 AM and 4:00 to 6:00 PM.


Counts like these need to be evaluated or analyzed considering various contexts. While the outcomes of such counts are often presented from the point of view of advocates and there is a tendency to play with the numbers (which I will explain in more detail in succeeding posts), the bigger picture relating bike numbers to other modes of transport would be among the most important. Trip purpose is another essential factor to be considered. And there is also data on the origin-destination characteristics of trips. Historical or time series data is also important if trends are to be established.
By itself, these bicycle counts are very important data that will ultimately be useful for planning, design and construction of facilities for active transport. The lack of data on bicycles while there is a bias for motor vehicle data means we cannot see the complete picture and therefore remain car-centric when dealing with transportation issues.
–
A Bike Master Plan for Metro Manila, Metro Cebu and Metro Davao
Before Active Transport Week concludes this weekend, I would just like to share this collage from one of our staff at the National Center for Transportation Studies of the University of the Philippines Diliman. It is about the Master Plan developed for the three metropolitan areas in the country – Metro Manila, Metro Cebu and Metro Davao. I will share more details about this soon including a link or links to where you can download a copy of the plan.

The project concluded recently with the submission of the Final Report but most important is the Master Plan document that can serve as a reference for further development of bike lanes in the metropolises. I’ve seen the Master Plan and many of its provisions and recommendations can easily be adopted or is replicable in other cities and municipalities in the country. Perhaps, there should be a National Master Plan?
–
Bike lanes at Bonifacio Global City
After settling down at our new ‘tambayan’ at BGC, I decided to take my regular morning walk around the area to familiarize myself with the environs and to establish a route that I and the wife would likely be taking for our constitutionals whenever we are staying at BGC. I took the following photos of the bike lanes along 38th Street where most of the locators are international schools.
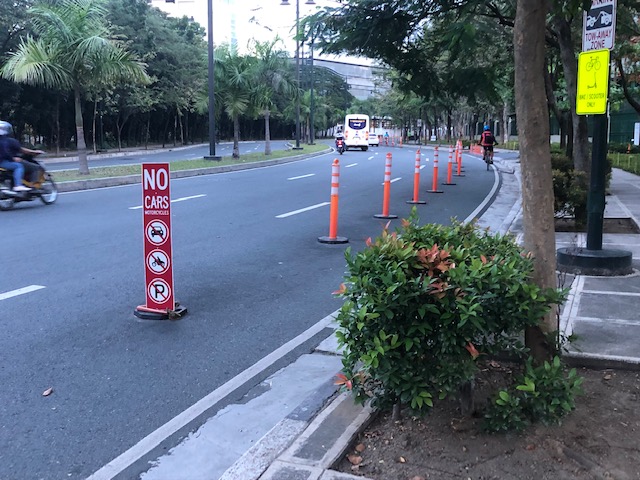
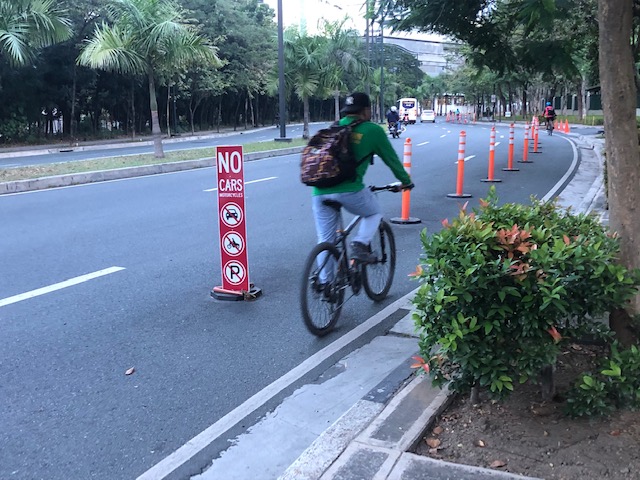
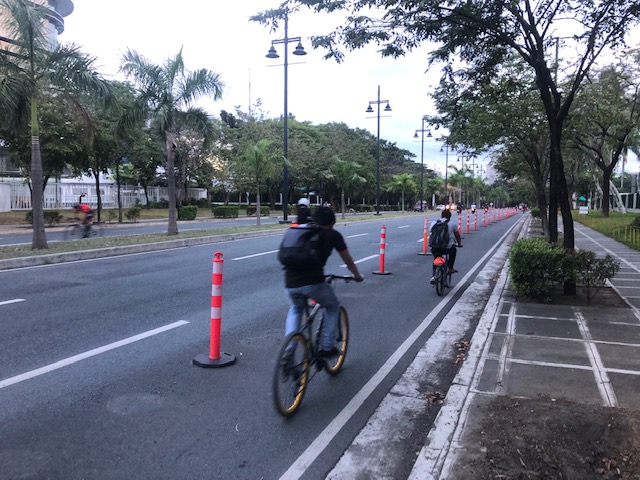
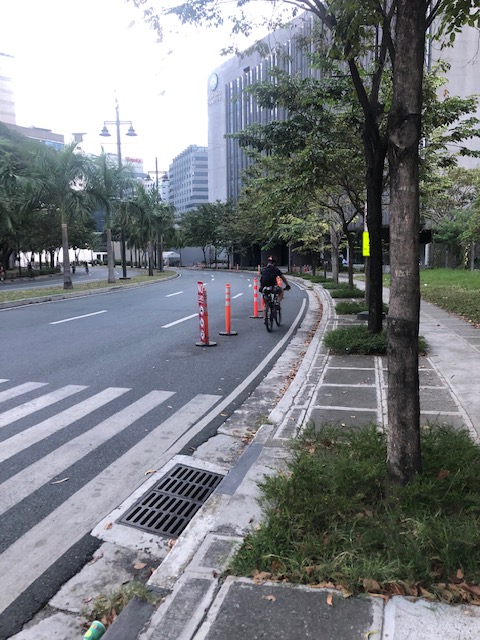
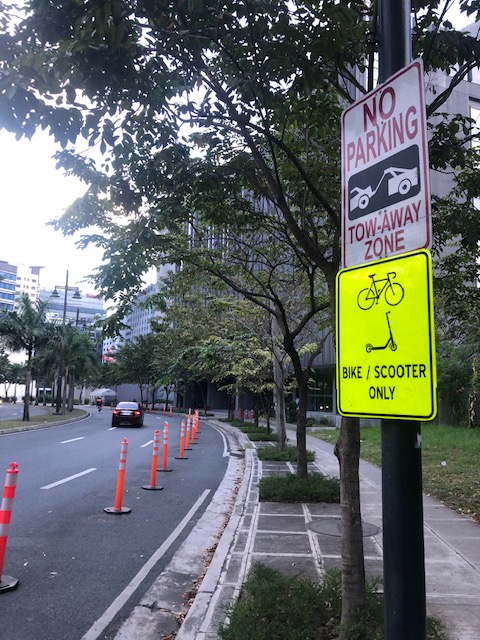
During Saturday and Sunday mornings, the bollards are moved to the sidewalk as many cyclists use 38th Street for laps. I wonder if the bike lanes will be retained once the schools resume face-to-face classes. That would mean a tremendous number of private vehicles generated by the international schools and colleges here. My opinion is that the bike lanes need to be retained as it is a step in the right direction for transport and encourages people to cycle or take PMDs to work and perhaps to school. These and others like it in Metro Manila and around the country need to be sustained and further developed to be attractive and viable to many seeking another option for mobility and their regular commutes.
–
Suffering and salvation for transport and traffic
I shared the following photo on social media with the label “Kalbaryo at Kaligtasan”:
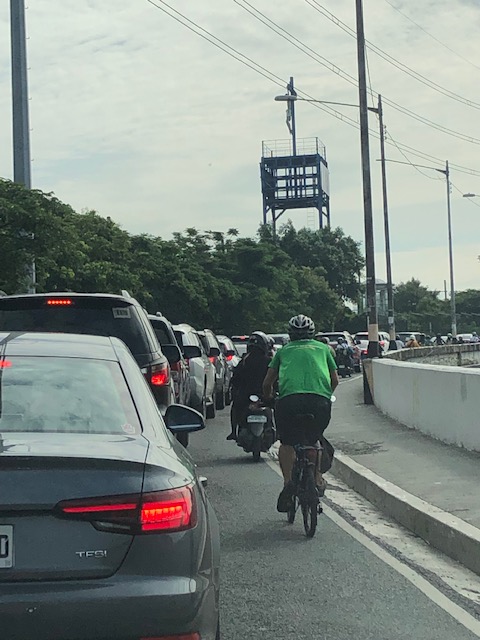 Cyclist pedaling ahead of cars queueing along the C5 ramp towards BGC
The label or title has double meaning. Conspicuous in the photo is the image of the Crucifixion atop what is a small shrine along Circumferential Road 5 across and facing SM Aura. The image appears to be a reminder or symbol of suffering but with the superimposed image of traffic congestion, alludes to the suffering endured by motorists on a daily basis. The “kaligtasan” or salvation part of the photo is in the form of the cyclist or the bicycle (I really have to explain that, right?) that offers an alternative or even hope for those who seek it. One thing the pandemic has taught us is that active transport in the form of walking or cycling is part of the solution to the transport problems we are experiencing. Public transport, of course, is touted as an ultimate solution but the reforms and infrastructure required are and will take time to implement, and these are already encountering problems leading to further delays or ineffectiveness.
–
On the right to a walkable life
Here is an article from a perspective that’s very relevant today everywhere. We need to examine our daily routines particularly when it comes to commuting or moving about. Do we live in walkable communities? Is walking to certain places like school, the market, or the office an option to many of us? Or do we automatically choose to ride a car, a tricycle or motorcycle to get to these places?
Malchik, A. (May 13, 2022) “Driving is killing us,” Medium.com, https://antoniamalchik.medium.com/driving-is-killing-us-6a1b35158458 [Last accessed: 5/28/2022]
To quote from the article:
“Ask yourself this question: if you stepped foot outside your door, would you be able to walk anywhere you needed or wanted to go? Can you walk to a store, a library, school, or work? If your answer is “no,” what’s stopping you? Distance, highways, private property, broken or absent or inaccessible sidewalks? …
The loss of walking as an individual and a community act has the potential to destroy our deepest spiritual connections, our democratic societies, our neighborhoods, our freedom, our health, and our lives. But we can reclaim it. We can start to make a world that welcomes the walker, the pedestrian, rather than paving over that incredible human inheritance.”
I myself have enjoyed the benefits of walking when I was a college student in UP, when I was studying abroad in Japan, when we lived in Singapore and now in our community in the midst of the pandemic. I always think about opportunities and even schedule times for walking. Nowadays I am even conscious of my daily step count, which I equate with being active.
–
On phasing out cars in cities
I’m sharing another article on reducing car dependence. The article was referred to by the previous series that I shared recently.
Nicholas, K. (April 14, 2022) “12 best ways to get cars out of cities – ranked by new research,” The Conversation, https://theconversation.com/12-best-ways-to-get-cars-out-of-cities-ranked-by-new-research-180642 [Last accessed: 5/20/2022]
Here are a few excerpts from the article:
“Question: what do the following statistics have in common?
The second-largest (and growing) source of climate pollution in Europe.
The leading killer of children in both the US and Europe.
A principal cause of stress-inducing noise pollution and life-shortening air pollution in European cities.
A leading driver of the widening gap between rich and poor urban residents.Answer: the vehicles on our streets, primarily the not-so-humble passenger car.”
also this:
“The research is clear: to improve health outcomes, meet climate targets and create more liveable cities, reducing car use should be an urgent priority.”
and this:
“To meet the planet’s health and climate goals, city governments need to make the necessary transitions for sustainable mobility by, first, avoiding the need for mobility (see Paris’s 15-minute city); second, shifting remaining mobility needs from cars to active and public transport wherever possible; and finally, improving the cars that remain to be zero-emission.”
You can also listen instead of reading it as it is a narrated article.
–
On walkability and walkability scores
I’m sharing a couple of articles on walkability and walkability scores. The first one actually points to the second but provides brief insights about the concept of walkability while the second is a more detailed article on the findings of a study on walkability.
Ionesco, D. (May 4, 2022) “Walkability Scores Don’t Tell the Whole Story,” Planetizen, https://www.planetizen.com/news/2022/05/117075-walkability-scores-dont-tell-whole-story?utm_source=newswire&utm_medium=email&utm_campaign=news-05052022&mc_cid=c04e3e4dc0&mc_eid=9ccfe464b1 [Last accessed: 5/7/2022]
To quote from the article:
“if cities truly want to be pedestrian-friendly, they need to think beyond the sidewalk…”
The second article is from late April:
Gwam, P., Noble, E. and Freemark, Y. (April 28, 2022) “Redefining Walkability,” urban.org, https://www.urban.org/features/redefining-walkability [Last accessed: 5/7/2022]
To quote from the article:
“To create a more comfortable walking experience, our research points to a few steps DC planners and policymakers can take to increase racially equitable walkability across the city:
-
expand tree cover in the densest parts of the city,
-
increase nonautomotive modes of transportation in central areas,
-
reduce noise pollution,
-
support more equitable access to key resources, and
-
prioritize road design that limits the need for police traffic enforcement.”
While the article puts emphasis on the topic of racial equity, such concept can easily be adapted and adopted for our purposes. For one, it could be interpreted as being inclusive if one is not comfortable with the term “race”.
Don’t miss downloading the technical appendix of their report. This will be very useful to researchers, practitioners and advocates of active transport.
–
