
There is a nice graphic going around social media about bicycle and vehicle ownership in the Philippines. It is attributed to the Social Weather Stations (SWS), which conducted a survey on vehicle ownership in the country during the first quarter of 2023. Most conspicuous is the inclusion of bicycles considering that past national surveys (especially those conducted by the PSA or NSA) did not include bicycles but only motor vehicles in their surveys.
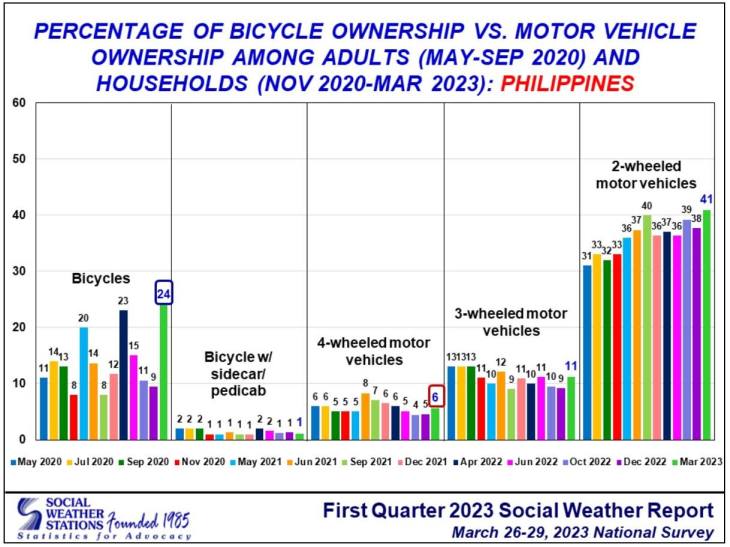
The graph shows many households owning bicycles (24% as of Mar 2023) while those who owned 4-wheel motor vehicles are only at 6%. The quick conclusion I see in many social media posts is that only 6% of HH use cars and that 24% use bicycles. This is actually fallacious and therefore misleading. Such assessments and conclusions is far from being factual considering ownership in this case does not necessarily translate to use, particularly for the most important trips made during the day – commutes to work and school. In other words, a household owning at least one bicycle does not mean they use it for their regular commutes.
The graph also states that the data is for the entire country. Thus, it does not give us a more accurate take for cities, particularly the highly urbanized ones. Are the % the same for cities like those in Metro Manila? How were the samplings conducted? These are important because if we have the wrong data and assumptions, we won’t be able to understand the problem at hand. We will not be able to formulate the most suitable solutions to address the transport problems we are experiencing. On the part of SWS, they should be clarifying what the data means rather than be content of people using their data to mislead or peddle narratives for advocacies that may be worthy yet use misinformation as a means to an end.
–

I wanted to leave a comment, because this article is one of the first I see when I try to search google for the Social Weather Station Motor vehicle ownership chart. A presentation of the report includes data for NCR, and you will see that it’s more or less the same percentage of car ownership. There’s also information on how the sampling was done and verified. https://www.sws.org.ph/downloads/publications/Bicycle%20Ownership,%20Usage,%20and%20Attitudes%20of%20Filipino%20Household%20Heads%20on%20Cycling%20as%20Transportation-CM%20Entoma%2024Aug2022%20807PM.pdf
Also wanted to add, that your argument for ownership not being equal to usage can also be applied to the 6% figure for car ownership. This could mean that the cars all the cars on the streets of Metro Manila account for even less than 6% of all car ownership. Which might make more sense, considering the number coding scheme. The scheme might mean that at any point in time, only 4/5ths of the total number of cars owner are being used (or rather allowed to be used). So in actuality, even if 6% of households own cars, only 80% of that 6% would be allowed to use it on a given day.
I think we already know that about car ownership in Metro Manila. It actually started back in the 1990s when one form of the coding scheme was implemented by the MMDA. It’s probably getting worse with people now buying hybrid and electric vehicles to add to their personal fleets. It doesn’t help that one incentive for hybrid and electric cars is that they are exempt from the number coding scheme. The poinf of the article is that the analysis about bike usage being equated to ownership is misleading and despite the apparent good intentions of advocates for cycling, they end up with the wrong numbers to engage agencies like the DPWH and MMDA.